


1. INTRODUCTION
The development of new technologies and increasing energy consumption have led to the development of new crude oil and natural gas fields, which require pipelines to reach markets, and the promotion of industries related to the development of deep sea and polar resources. Pipeline construction is known to require more than 17,000 welds. Therefore, improving welding productivity is very important to reduce the cost of pipeline construction. The pipeline welds also require high strength, toughness, and resistance to sulfide stress corrosion cracking (SSCC) and hydrogeninduced cracking (HIC) to prevent leaks and protect the environment [1]. Normally, gas metal arc (GMA) welding is used in pipeline construction. In GMA welding, multilayer welding with 4-8 passes is employed, depending on the pipe thickness. In contrast, laser beam (LB) welding can be completed in 1-2 passes which can reduce construction costs significantly [2]. However, due to the rapid cooling rate of LB welding, low temperature transformation phases, which are harder than the microstructure of GMA welds, can appear in the LB welds [3]. According to the National Association of Corrosion Engineers (NACE) standard, the welds of low alloy carbon steels are limited to 250 HV or less [4]. In the service environment of the pipeline, because of the hydrogen produced by H2S gas and cathodic protection, low temperature transformation phases can be exposed to a hydrogen embrittlement environment, leading to hydrogen sulphide stress corrosion cracks (SSCC) or hydrogen induced cracks (HIC) [5-13]. Many studies on the SSCC of arc welds have been conducted [10,11]. Within the authors' knowledge, however, there is no SSCC study on the LB welds of carbon steel, although a few SSCC studies on the LB welds of stainless steels have been reported [14]. The evaluation of SSCC or HIC of LB welds is therefore essential to the application of LB welding to pipeline construction.
SSCC tests should be conducted in accordance with NACE standards by injecting H2S gas into a 5% NaCl and 0.5% CH3COOH aqueous solution [15,16]. However, H2S is a highly toxic gas that can lead to skin burns or blindness through exposure. As a result, SSCC tests require a safety system for H2S experiments, and take 30 days to complete the test. Accordingly, they are only conducted in a limited number of facilities. Besides these reasons, SSCC is hard to quantify because it is evaluated by a crack ratio using ultrasonic inspection, and has a wide crack ratio spread.
SSCC and HIC have a common failure mechanism, hydrogen embrittlement [17-19]. Specifically, Kim et al. [20] compared the fracture behavior of the SSCC test with H2S gas and the HIC test charged electrochemically with hydrogen. They proved that the failure behavior of the SSCC and HIC tests was the same. As a result, SSCC and HIC tests using electrochemically charged hydrogen instead of H2S gas were approved.
This study investigated HIC behavior with respect to the welding method for American Petroleum Institute (API) X65 pipe line steel. For the GMA and LB welds, the microstructure, hardness, tensile strength, and HIC property were analyzed before and after hydrogen charging. Finally, the application of LB welding with high welding productivity was examined in a HIC environment, and compared to conventional GMA welding.
2. EXPERIMENTAL DETAILS
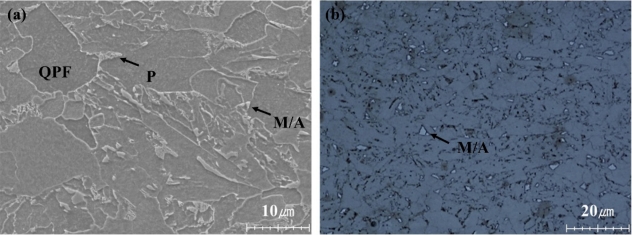
The material used in this study is API X65 pipeline steel of 12.7 mm thickness. The chemical composition of the base metal is shown in Table 1. Figure 1 shows the microstructure of the API X65 base metal. The base metal had a yield strength of 490 MPa, tensile strength of 620 MPa, elongation of 37%, and hardness of 190 HV. The base metal mainly consisted of quasi-polygonal ferrite (QPF) with some pearlite (P) and martensite/austenite (M/A) phases. Figure 1b shows the white M/A phase, which was clearly observed using the LePera etching method [21,22].
The welds were produced by GMA and LB welding, and the welding conditions are shown in Table 2. GMA welding was carried out using the CMT welder with a 40o V-groove, a 2 mm root face, and a filler wire of AWS A5.18 ER70S-6 standard. Heat input, welding velocity, and the total number of passes of GMA welding were 15 kJ cm−1, 0.4 m min−1, and 2 passes, respectively. LB welding was performed using an Yb:YAG disk laser with a maximum output of 12 kW, and welded as an I-butt shape without filler metal. Laser power, wave length, focal length, welding velocity, and the total number of passes of LB welding were 8.6 kW, 1070 nm, -3 mm, 1.5 m min−1, and 1 pass, respectively.
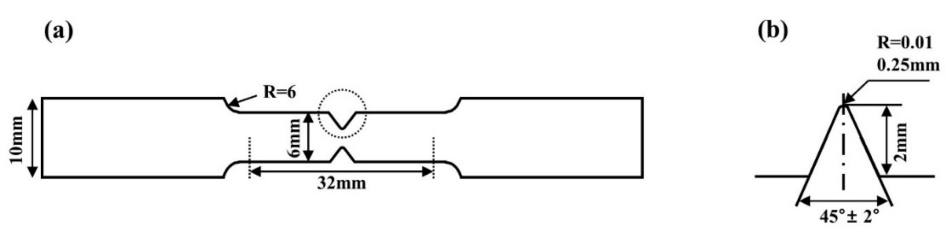
Figure 2a indicates the specimen used for the HIC test. The specimen was obtained from the root area, with approximately 5-mm thickness, along the transverse welding direction. In welds the root area is the most exposed to hydrogen environments such as the crude oil and natural gas that are being transported through the pipeline. In order to evaluate the HIC resistance of the weld, a V-notch was made in the center of the weld, indicated by the dotted circle in Fig. 2a. The detailed shape of the V-notch is shown in Fig. 2b. After polishing the specimen to charge hydrogen constantly, hydrogen charging was carried out in an aqueous solution of 0.1 M NaOH and 1 g/L thiourea at a current density of 5 mA cm−2. Before the in-situ slow strain rate test (SSRT), the test specimen was pre-charged for 12 h to saturate hydrogen across the surface and inside. Then, SSRTs were conducted in atmosphere and in-situ with hydrogen during the tensile test. The SSRT was tested at a crosshead speed of 2.5 × 10⁻⁶ mm s−1.
After polishing up to 1 μm and etching in a 2% nital solution, the microstructures of the LB and GMA welds were observed using optical microscopy (OM) and scanning electron microscopy (SEM). Specifically, the martensite/austenite (M/A) phase was observed by OM after LePera etching. Micro-Vickers hardness was measured at intervals of 0.5 mm under a load of 0.5 kg. Following the SSRT, the fracture surfaces were observed using SEM after ultrasonic cleaning, and the cross-sectional microstructure below the fracture surface was analyzed by electron backscattered diffraction (EBSD).
3. RESULTS AND DISCUSSION
3.1 Microstructure and hardness of the GMA and LB welds
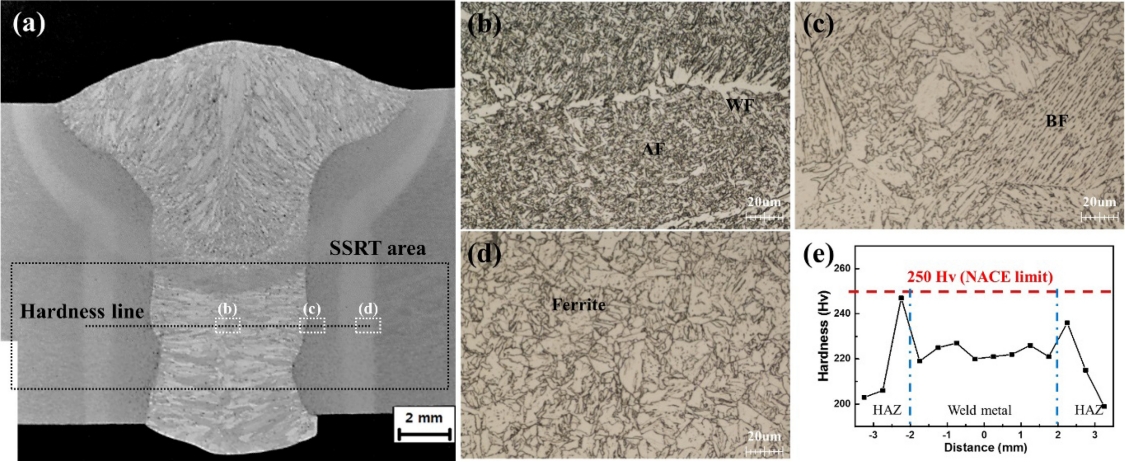
Figure 3 indicates the microstructure and hardness distribution of the GMA weld and the heat affected zone (HAZ). Full penetration was achieved for the GMA weld and the first pass in the root was investigated by microstructural analysis. The GMA weld mainly consisted of acicular ferrite (AF) with some widmanstatten ferrite (WF) (Fig. 3b), coarsegrained heat affected zone (CGHAZ) of coarse bainitic ferrite (BF) (Fig. 3c), and a fine-grained heat affected zone (FGHAZ) of fine ferrite (Fig. 3d). The hardness of the GMA weld was approximately 220-230 HV, while the CGHAZ consisting of BF showed the highest hardness of 235-245 HV. The FGHAZ, which had finer ferrite than the base metal, showed a hardness of 200-210 HV, which was larger than that of the base metal. Therefore, the GMA weld and HAZ showed a hardness lower than 250 HV, which is the limit specified by the NACE standard.
Figure 4 shows the microstructure and hardness distribution of the LB weld and HAZ. Full penetration was achieved for the LB weld and the bottom part in the root was investigated by microstructural analysis. Since the LB welding has a higher cooling rate than the GMA welding, the LB weld was composed of BF with a fine lath structure. The CGHAZ and FGHAZ of the LB welds consisted of BF and fine ferrite, respectively. The LB weld had the highest hardness of ~287 HV, while the CGHAZ, which had finer BF than the GMA welding, showed a hardness of ~270 HV. The FGHAZ of the LB welding, which had a finer ferrite than the base metal, showed a hardness of ~235 HV. According to the NACE standard, welds and HAZ with a hardness of 250 HV or more are not suitable for use in an H2S environment [4]. Based on this, the HIC behavior of the LB welds will be evaluated in the next section.
3.2 Hydrogen-induced cracking of GMA and LB welds
Figure 5 shows the effect of hydrogen and the welding processes on the stress-displacement graph and the ultimate tensile stress (UTS) values using the V-notched tensile specimens in the SSRT. The LB welds showed a larger UTS value than the GMA welds. The reason for this is believed to be the microstructure of the LB welds, which were composed of finer BF and had higher hardness than the GMA welds. The yield strength of the LB and GMA welds showed an insignificant change after the in-situ SSRT, while the UTS and displacement decreased significantly. The UTS after hydrogen charging decreased by 13% for the GMA welds and 16% for the LB welds, compared to the SSRT in air. The GMA below 250 HV and LB welds above 250 HV showed nearly the same behavior with regard to the HIC observed by in-situ SSRT.
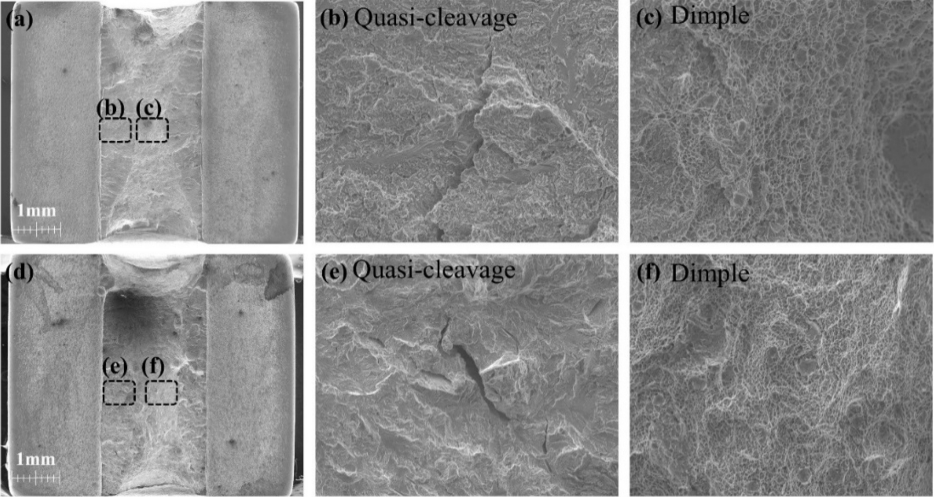
Figure 6 shows the fracture surfaces of the GMA and LB welds after an in-situ SSRT. Regardless of the welding method, the tensile cracks started from the notched edge and exhibited quasi-cleavage fracture (QCF). Moreover, the cracks propagated to the center of the specimen and showed dimple fracture (DF). Since tensile stress was applied to the V- notched specimen, the maximum stress was applied near the notch surface, thus promoting QCF. Moreover, the crack propagated into the center with hydrogen diffusion, regardless of the welding method [23]. Since the crack propagation at the specimen center was promoted by external load and was more rapid than hydrogen diffusion, DF was observed in the center of the specimen [24]. Therefore, the HIC failure behavior was mostly the same, regardless of the welding method.
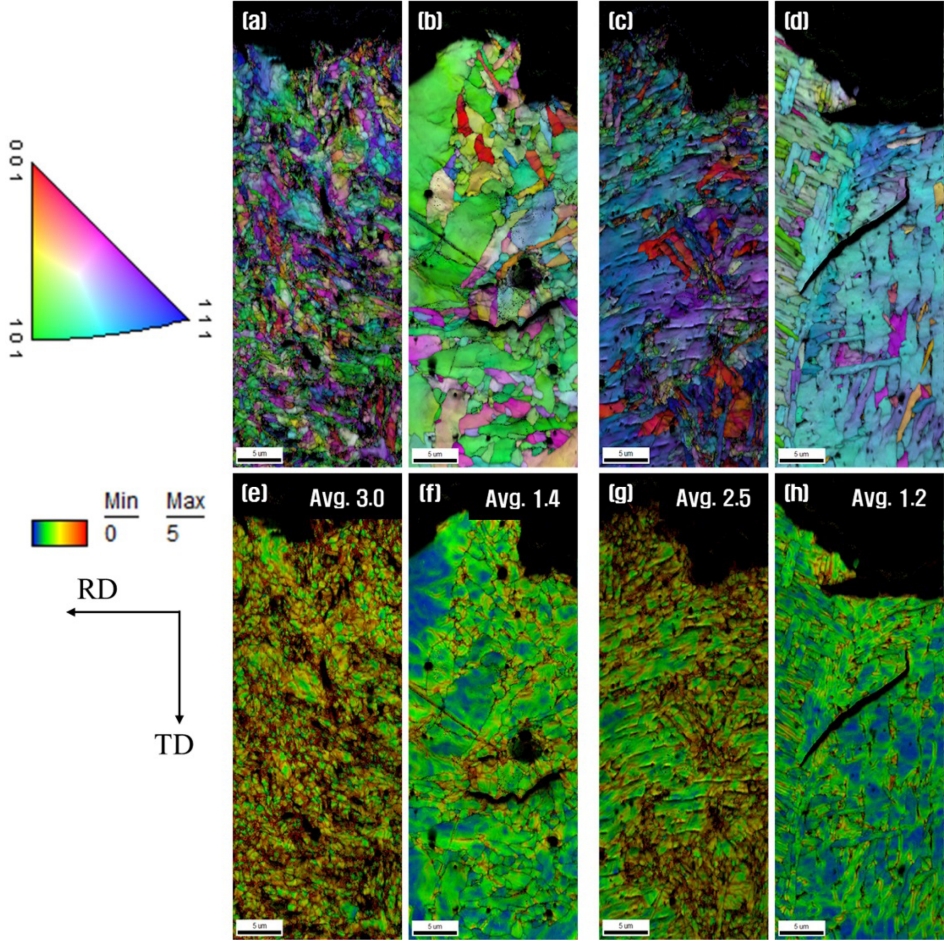
Figure 7 shows the inverse pole figure (IPF) and the kernel average misorientation (KAM) map, with the average value of each specimen measured from the EBSD analysis after SSRT, and in-situ SSRT. The KAM value can be the indicator of the misorientation of a material and the degree of deformation. A higher KAM value is normally correlated to more deformation. Before hydrogen charging, regardless of the welding method, the KAM map was brown in color, with the GMA and LB welds showing high KAM values of 3.0 and 2.5, respectively. The high KAM values of 2.5-3.0 were associated with greater plastic deformation during crack propagation [25]. After hydrogen charging, the KAM map was greenish-blue in color, with the GMA and LB welds showing low KAM values of 1.4 and 1.2, respectively. The low KAM values of 1.2-1.4 were associated with easy crack propagation and brittleness. Comparing the KAM values before hydrogen charging, the GMA welds showed a decrease in KAM values of ~50% after hydrogen charging, while the LB welds also showed a ~50% decrease in KAM values after hydrogen charging. This means that the HIC behavior of the two welding methods were nearly the same with regard to ΔUTS (Fig. 5b) and fracture (Figs. 6 and 7).
3.3 Grain boundary distribution in the GMA and LB welds
Although the LB welds of API X65 steel had a hardness higher than 250 HV and the GMA welds showed a hardness lower than 250 HV, the two welding processes showed nearly the same HIC behavior. Therefore, grain boundary characteristics were quantitatively analyzed from the EBSD measurement in order to explain why the HIC behavior was the same for the LB and GMA welds. Mohtadi-Bonab et al. [26-29] and Venegas et al. [30,31] reported that the resistance of SSCC increased if grain boundaries had specific orientation relationships, especially Σ3 and Σ13b. A grain boundary with a specific orientation relationship is called a coincidence site lattice (CSL), which has a lower interface energy than other grain boundaries. The CSL has high resistance to corrosion and crack propagation [32,33]. Σ3 and Σ13b are the most frequently appearing CSL when the textures are {112}, {111}, {110} // Normal Direction (ND).
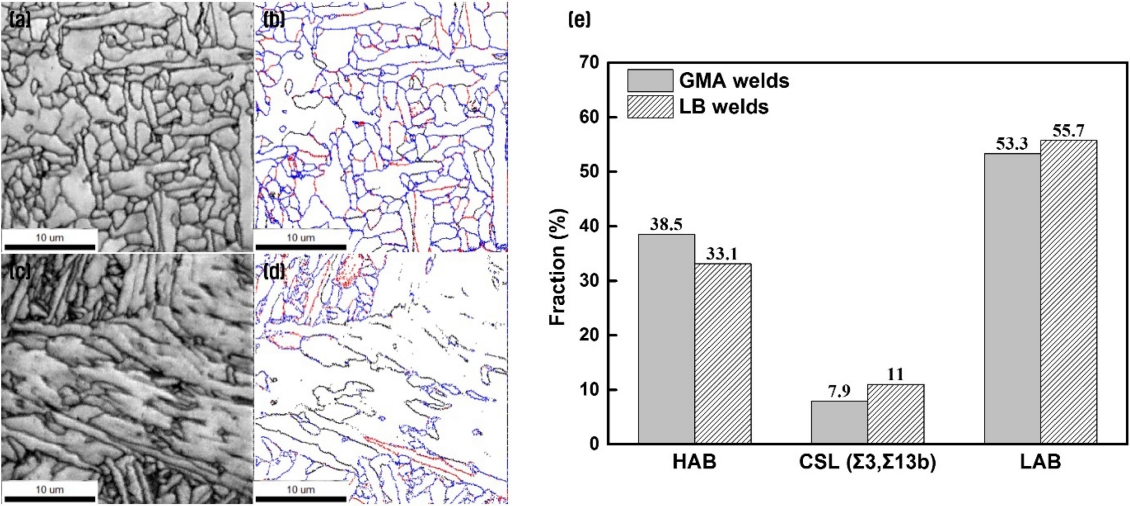
Figures 8a-8d show image quality (IQ) maps and grain boundary maps for GMA and LB welds obtained from EBSD. The blue lines indicate a high angle grain boundary (HAB) with a misorientation larger than 15o. Red lines represent the CSL boundary, and black lines represent the low angle grain boundary (LAB) with misorientation of less than 15 °. Figure 8e shows the grain boundary distribution quantified through the EBSD results for the LB and GMA welds.
The LB welds, where BF was the main microstructure, and the GMA welds, where AF was the main microstructure, showed HABs of 33.1% and 38.5%, respectively. Furthermore, the LAB fraction of the LB welds was 55.7%, which was larger than that of the GMA welds (53.3%). In addition, the Σ3 and Σ13b CSL fraction of the LB welds (11%) was larger than that of the GMA welds (7.9%). In low carbon steels, the {111} planes are in the twinning direction, while the {110} planes are in Kurdjumov-Sachs relation, preferentially growing in bainitic ferrite and martensite transformation [34-36]. Due to the transformation and growth behavior of these microstructures, the LB welds contained more Σ3 and Σ13b CSLs. Therefore, even though the LB welds had higher hardness compared to the GMA welds, the two types of welds showed similar HIC resistance to crack propagation. Therefore, based on the HIC result, GMA welding can be replaced with LB welding for API X65 steel to improve welding productivity.
4. CONCLUSION
The HIC behavior of API X65 steel was analyzed for GMA and LB welds, and the following results were obtained.
1. The GMA welds with 2 multi-passes had a microstructure mainly consisting of AF and some WFs. The hardness of the GMA welds and the HAZ were lower than 250 HV. However, the microstructure of 1-pass LB welds mainly consisted of BF and some AFs. The LB weld and the HAZ showed a hardness higher than 270-287 HV, which was above the NACE standard of 250 HV.
2. The HIC weld behavior was analyzed using in-situ SSRT. Regardless of hydrogen charging, the LB welds exhibited a larger UTS than the GMA welds. All welds showed decreased UTS and displacement after hydrogen charging. The decrease in UTS value after hydrogen charging resulted in nearly the same HIC behavior for the GMA weld (13%) and the LB weld (16%). The fracture surface and the KAM average value of the GMA and LB welds showed similar tendencies.
3. In the LB welds, more Σ3 and Σ13b CSL grain boundaries with higher crack resistance were formed during the formation of the BF microstructure than in the GMA welds. Therefore, the LB welds showed nearly the same HIC behavior as the GMA welds, despite having higher hardness than the NACE standard of 250 HV.
4. From the perspective of HIC behavior, replacing conventional GMA welding with LB welding and its higher welding productivity seems appropriate for producing API X65 pipeline.