


1. INTRODUCTION
Tetrahedrite, which exhibits p-type semiconductor characteristics, is an earth-abundant sulfosalt natural mineral that has received much attention as an economical and ecofriendly material. Studies are being conducted to improve its thermoelectric performance by doping with synthetic tetrahedrite Cu12Sb4S13 [1-3]. Previous research has focused on substitution with transition metal elements (Zn, Fe, Mn, and Ni) at Cu sites [4]. Tetrahedrite has a body-centered cubic structure (space group I4 ¯ Cu 10 I Cu 2 II Sb 4 S 12 I S II
When tetrahedrite is synthesized using the conventional melting method, precise temperature controls (very slow heating-holding-cooling steps) are required because the boiling point of S is lower than the melting point of Cu. Phase transformation and homogenization occur only after a long period of heat treatment [10,11]. Tanaka et al. [12] required more than 260 h (approximately 11 d) to synthesize homogeneous tetrahedrite via annealing after melting. Mechanical alloying (MA) has the advantages of avoiding phase separation and enabling homogenization by preventing the volatilization of elements [13]. Therefore, in this study, MA was employed for effective solid-state synthesis to suppress the volatilization of the constituent elements, and hot pressing (HP) was performed to sinter the synthetic tetrahedrite.
To improve the thermoelectric properties of tetrahedrite, many studies have been conducted by substituting (doping) transition elements (Zn, Ni, Co, Fe, Mn, etc.) at the Cu sites [5,14-17]. The natural mineral tetrahedrite contains As, Bi, and Te as impurities at the Sb sites, and therefore, these elements can be used as dopants for synthetic tetrahedrite, however only a few studies have reported doing so [2,18,19]. In our previous study [18], Bi-doped tetrahedrites Cu12Sb4-yBiyS13 were prepared using the MA-HP process. The Cu12Sb3.9Bi0.1S13 exhibited a high ZT = 0.88 at 723 K owing to the high power factor (1.02 mWm-1K-2) and low thermal conductivity (0.96 Wm-1K-1). Lu et al. [19] synthesized and consolidated Te-doped Cu12Sb4-yTeyS13 by encapsulated melting (EM) and HP methods, and Cu12Sb3TeS13 achieved ZT = 0.92 at 723 K owing to the high Seebeck coefficient (194 μVK-1) and low thermal conductivity (0.77 Wm-1K-1). Levinsky et al. [20] prepared As-doped Cu12Sb4-yAsyS13 using EM and spark plasma sintering (SPS), and reported ZT = 0.75 at 700 K, for Cu12Sb2As2S13, because of the very low lattice thermal conductivity (0.5 Wm-1K-1).
In the present study, various Cu12Sb4-ySiyS13 (y = 0.1-0.4) samples were doped with Si at Sb sites and synthesized using MA and HP, and their thermoelectric properties were examined. Since additional electrons are generated by partially substituting Si4+ for Sb3+, changes in the electrical and thermal properties were expected due to changes in carrier concentration.
2. EXPERIMENTAL PROCEDURE
MA was used to synthesize the Si-doped tetrahedrites Cu12Sb4-ySiyS13 (y = 0.1, 0.2, 0.3, and 0.4). Elemental powders of Cu (purity 99.9%, < 45 m, Kojundo), Sb (purity 99.999%, < 150 mm Kojundo), Si (purity 99.99%, < 75 mm, Kojundo), and S (purity 99.99%, < 75 mm, Kojundo) were weighed according to their stoichiometric compositions. MA was conducted at 350 rpm for 24 h in an Ar atmosphere using a planetary ball milling system (Pulverisette5, Fritsch). The synthesized powder was sintered at 723 K for 2 h under 70 MPa via HP. The detailed MA-HP process conditions were reported in our previous study [21].
The phase was analyzed by X-ray diffraction (XRD; D8-Advance, Bruker) using Cu-Kα radiation. The fractured surfaces of the sintered specimens were observed using a scanning electron microscope (SEM; Quanta400, FEI), and chemical compositions were analyzed using an energy dispersive spectrometer (EDS; Quantax200, Bruker). The homogeneous distribution of the elements was confirmed by EDS elemental mapping. Charge transport parameters were measured using the van der Pauw method (Model 7065, Keithley). The Seebeck coefficient (a) and electrical conductivity (σ) were measured in a He atmosphere using the temperature-differential and DC four-probe methods, respectively (ZEM-3, Advance Riko), and then the power factor (PF = α2σ) was evaluated. Thermal diffusivity was measured using the laser flash method (TC-9000H, Advance Riko) in vacuum, and thermal conductivity (κ) was estimated from the thermal diffusivity, density, and specific heat. Finally, the dimensionless figure of merit (ZT = α2σTκ-1) was examined.
3. RESULTS AND DISCUSSION
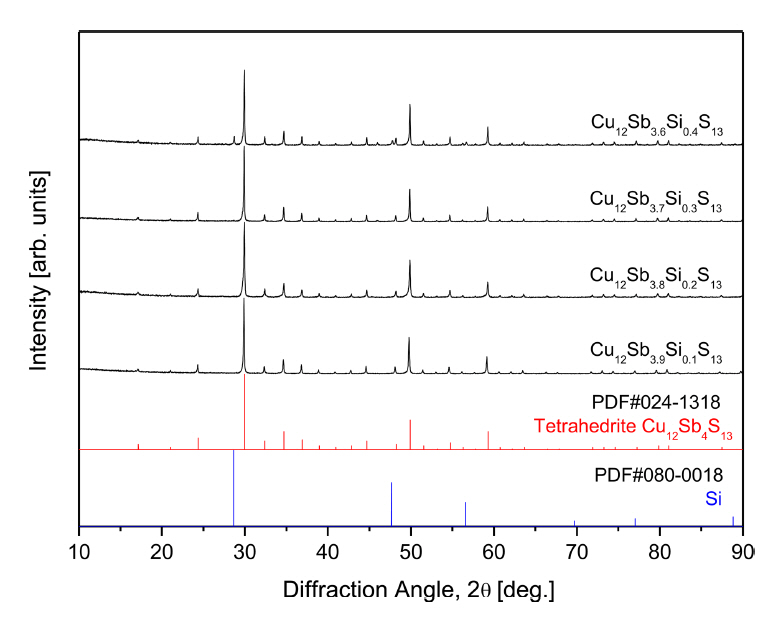
Figure 1 shows the results of the XRD analysis of sintered Cu12Sb4-ySiyS13 produced by the MA-HP method. The tetrahedrite phase (ICDD PDF#024-1318) was successfully synthesized, and no Cu-Sb-S- or Cu-S-based secondary phases were identified. However, diffraction peaks for residual Si (ICDD PDF#080-0018) were observed for Cu12Sb3.6Si0.4S13. The lattice constant calculated by the Rietveld refinement (TOPAS Program) decreased from 1.0357 to 1.0336 nm as the Si content increased (Table 1). In our previous study, the lattice constant of undoped tetrahedrite (Cu12Sb4S13) was reported to be 1.0391 nm [22]. Wuensch et al. [23] reported a similar value of 1.0390 nm. The decreased lattice constant was attributed to the substitution of smaller Si4+ ions (ionic radius: 26 pm) for Sb3+ (ionic radius: 76 pm) [24]. When y ≥ 0.3, the lattice constant changed little, and the solubility limit of Si for Sb was considered, as shown in Fig 1.
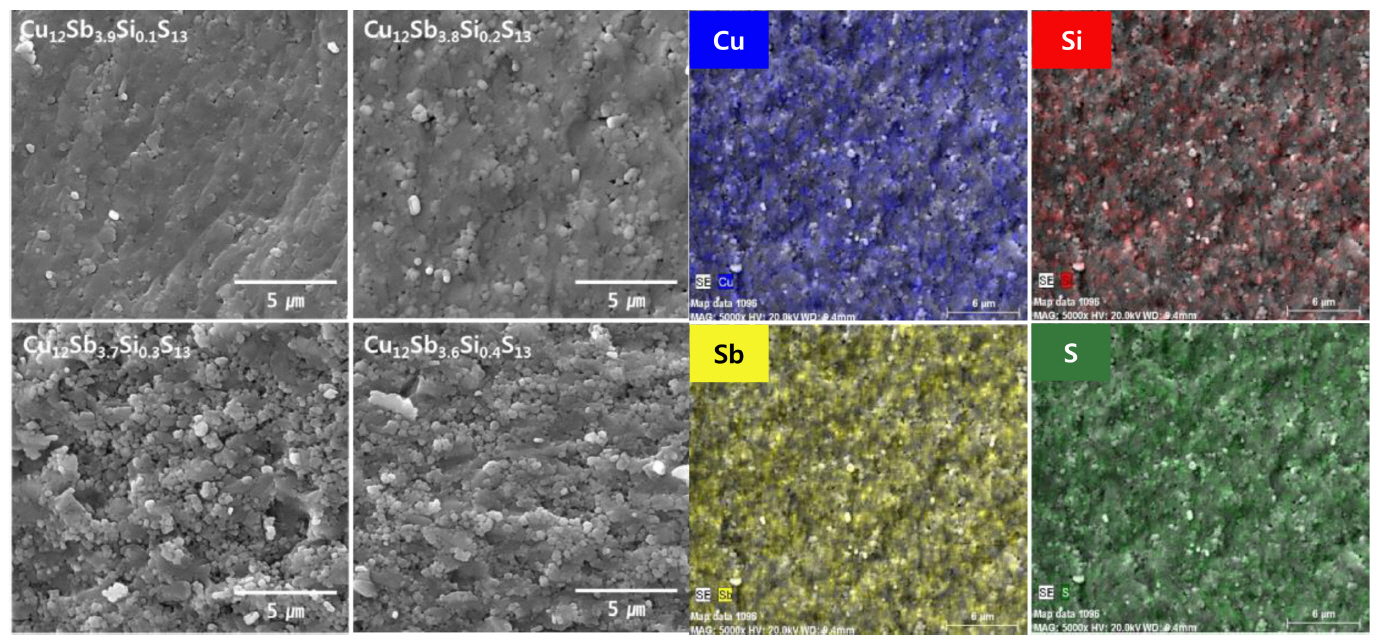
Figure 2 presents SEM images of the fractured surfaces of the sintered Cu12Sb4-ySiyS13. No remarkable difference in the microstructure was observed depending on the Si content, and a high post-sintering density was confirmed. As shown in Table 1, the relative density ranged between 98.9-100.0%, and the actual compositions resembled the nominal compositions. Figure 2 shows the EDS elemental maps of Cu12Sb3.8Si0.2S13, indicating homogeneous distribution of all the constituent elements. These results indicate the MA-HP process used for solid-state synthesis suppressed the volatilization of the component elements, forming a homogeneous tetrahedrite phase.
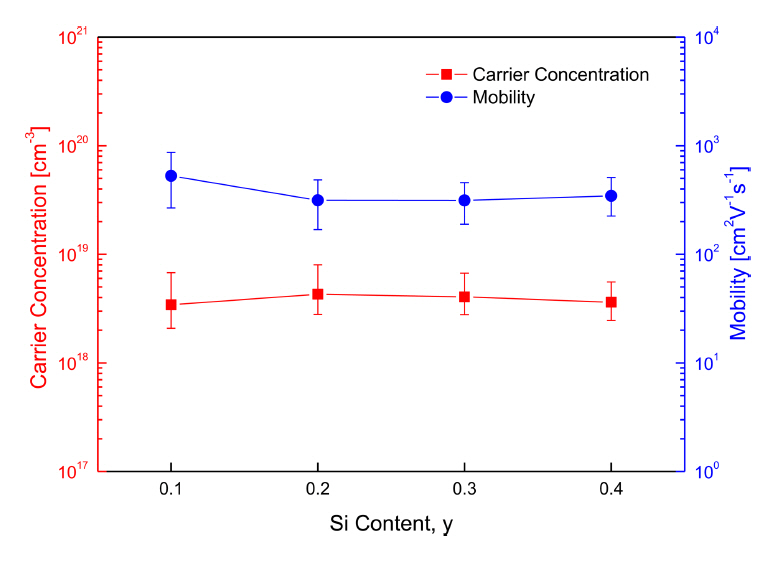
Figure 3 shows the carrier concentration and mobility with respect to Si content. The carrier concentration increased slightly with Si content, and then decreased for the specimens with y ≥ 0.3, while the mobility exhibited the opposite trend. This result was inconsistent with the expected outcome, that the majority carrier (hole) concentration would decrease since the Si substituted at the Sb sites generated electrons. For y ≥ 0.3, no significant changes occurred in either the carrier concentration or mobility, because of the solubility limit of Si for Sb. However, the Hall coefficient values measured in this study were unreliable; when more than 15 measurements were performed on the same specimen there was severe deviation in the values. Similar studies which attempted to measure the Hall coefficient of tetrahedrite have failed because the Hall coefficient values were close to zero, even when measured using magnetic fields of several Tesla [25].
Figure 4 shows the Seebeck coefficients of the Cu12Sb4-ySiyS13 samples. Positive Seebeck coefficients were obtained for all the specimens, indicating that the majority carriers were holes, indicating p-type semiconductors. The Seebeck coefficient increased as the temperature increased to 723 K. The intrinsic transition temperature of the Si-doped tetrahedrites was considered to be much higher than 723 K, because an intrinsic transition would rapidly increase the carrier concentration and lower the Seebeck coefficient. The Seebeck coefficient increased as the Si content increased at constant temperature.
In the temperature range of 323-623 K, Cu12Sb3.6Si0.4S13 possessed higher Seebeck coefficients of 136-169 μVK-1, but Cu12Sb3.7Si0.3S13 exhibited the highest Seebeck coefficient of 178 μVK-1 at 723 K. In our previous studies, the Seebeck coefficient of undoped Cu12Sb4S13 [22] ranged from 144-190 μVK-1 at 323-723 K, while Bi-doped Cu12Sb3.9Bi0.1S13 [18] exhibited 154-187 μVK-1 at 323-723 K. Lu et al. [19] reported a significantly improved Seebeck coefficient with Te doping, resulting in a high Seebeck coefficient of 194 μVK-1 at 723 K for Cu12Sb3TeS13. Levinsky et al. [20] reported that the Seebeck coefficient of As-doped tetrahedrite increased monotonically as the temperature increased above 300 K regardless of the As content. They explained that this was consistent with the diffusive nature expected to occur in non-degenerate semiconductors. Hence, all of the Cu12Sb4-yAsyS13 (y = 0-4) samples exhibited almost the same Seebeck coefficient values: 120-130 μVK-1 at 300-700 K. In this study, it was determined that the Seebeck coefficient increased with the hole concentration because of the additional electrons caused by the doping with Si4+ at the Sb3+ sites.
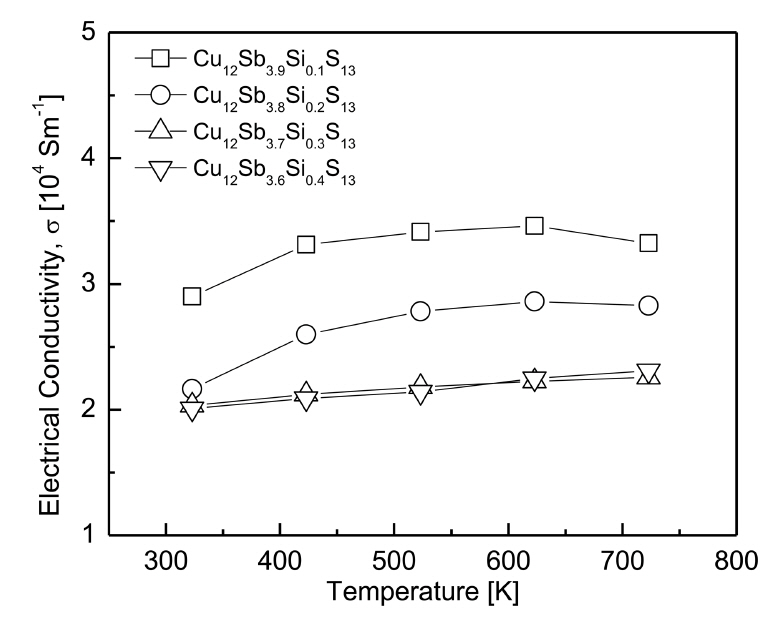
Figure 5 shows the electrical conductivity of the Cu12Sb4-ySiyS13. For the specimens whose Si content was y ≤ 0.2, the electrical conductivity increased with temperature and then decreased slightly after reaching a peak value at 623 K, indicating the transition to conduction behavior, from non-degenerate semiconducting to degenerate semiconducting (metallic). Nasonova et al. [7] proposed that the increase in electrical resistivity signified a charge-ordering metal-to-semiconductor transition that should be accompanied by structural changes. However, the specimens with y ≥ 0.3 exhibited non-degenerate semiconductor behavior, in which the electrical conductivity increased with the temperature.
The electrical conductivity decreased as the Si content increased at a constant temperature. Cu12Sb3.9Si0.1S13 exhibited the highest electrical conductivity of (2.8-3.5) × 104 Sm-1 at 323-723 K, which was similar to (2.6-3.8) × 104 Sm-1 at 323–723 K for the undoped tetrahedrite Cu12Sb4S13 reported in our previous study [22]. Kwak et al. [18] reported that the electrical conductivity of Bi-doped tetrahedrite increased with the Bi content, and hence, Cu12Sb3.7Bi0.3S13 exhibited the highest electrical conductivity of (3.1-3.5) × 104 Sm-1 at 373–723 K. However, the lowest electrical conductivity was observed for Cu12Sb3.6Bi0.4S13 because of the existence of a secondary phase (skinnerite Cu3SbS3). Lu et al. [19] observed that for Te-doped tetrahedrites, carrierphonon scattering began to dominate and the mobility decreased when the temperature reached 500–600 K, resulting in increased electrical resistivity (electrical conductivity decreased). Thus, Cu12Sb3.9Te0.1S13 exhibited a low electrical resistivity (high electrical conductivity) of 1.5 × 10⁻⁵Ωm (6.7 × 10⁴Sm-1) at 723 K. Levinsky et al. [20] reported that As-doped tetrahedrites exhibited metallic behavior, in which the electrical resistivity increased with temperature and As content at 300-700 K. Consequently, Cu12Sb3AsS13 displayed the lowest electrical resistivity (highest electrical conductivity) of 1.2 × 10⁻⁵Ωm (8.3 × 10⁴ Sm-1) at 700 K.
The power factor for the Cu12Sb4-ySiyS13 is shown in Fig 6. The power factor, which was calculated using the relation PF = α2σ, is proportional to the Seebeck coefficient and electrical conductivity. However, the Seebeck coefficient is inversely proportional to the carrier concentration, while the electrical conductivity is proportional to the carrier concentration [26]. Thus, there is trade-off relationship with these two parameters. As the temperature increased, the power factor increased because of the temperature dependence of the Seebeck coefficient and electrical conductivity. When the Si content increased at a constant temperature, the power factor tended to decrease, especially at high temperatures. This indicates that the decrease in the electrical conductivity dominated over the increase in the Seebeck coefficient for the decrease in the power factor by Si doping. Cu12Sb3.9Si0.1S13 exhibited the highest power factor of 0.86 mWm-1K-2 at 723 K because the electrical conductivity was the highest, although the Seebeck coefficient was the lowest. In our previous study [18], Cu12Sb3.9Bi0.1S13 achieved a maximum power factor of 1.02 mWm-1K-2 at 723 K owing to a high Seebeck coefficient. Lu et al. [19] obtained a higher power factor of 1.22 mWm-1K-2 at 723 K for Cu12Sb3.9Te0.1S13 (calculated using the Seebeck coefficient and electrical resistivity reported in the literature) because of the low electrical resistivity. Levinsky et al. [20] reported the highest power factor of 1.30 mWm-1K-2 at 700 K for Cu12Sb3AsS13 (calculated from the Seebeck coefficient and electrical resistivity reported in the literature). Therefore, in this study, Si doping at Sb sites was ineffective at further improving the power factor of tetrahedrite.
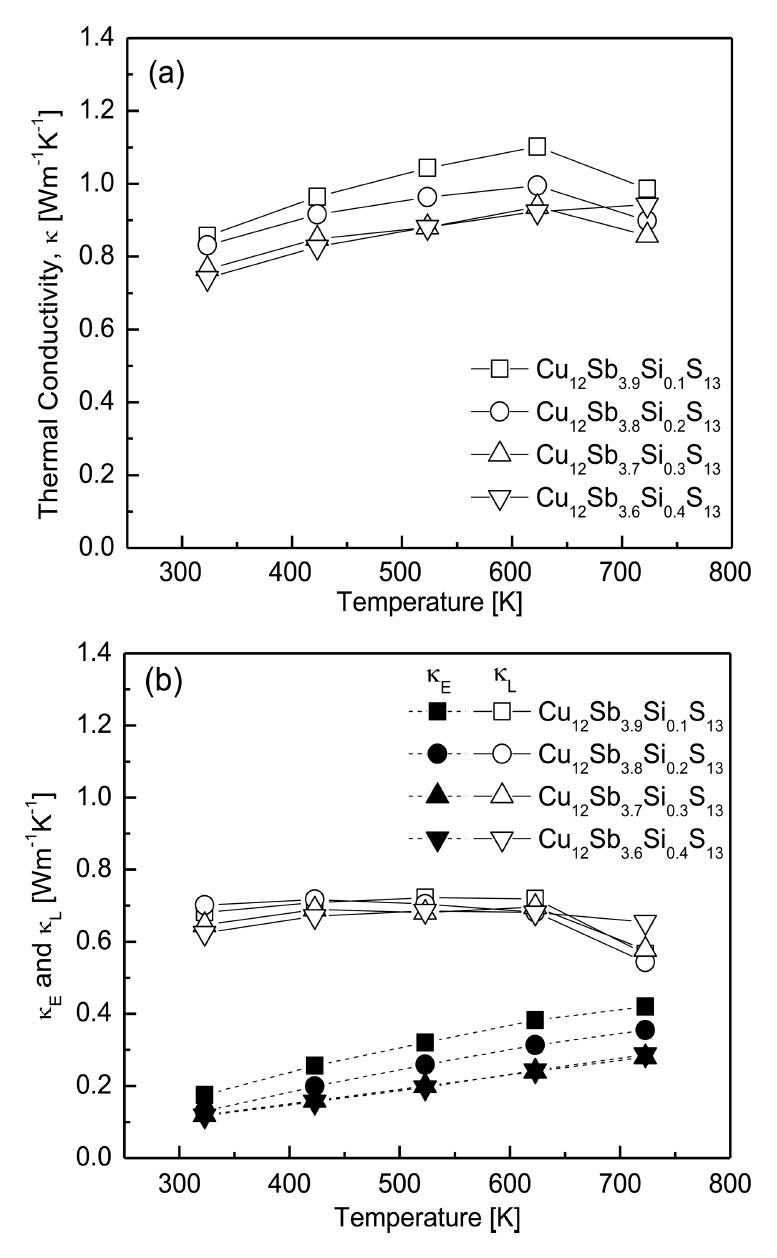
Figure 7 shows the thermal conductivities of Cu12Sb4-ySiyS13 which is expressed as the sum of the electron thermal conductivity (κE) of carriers and the lattice thermal conductivity (κL) by phonons, which can be separated by the Wiedemann-Franz law (κE = LσT, L: Lorenz number) [27]. The Lorenz number was estimated using the equation L [10-8 V2K-2] = 1.5 + exp(-|α|/116) [28]. As shown in Fig 7(b), the electronic thermal conductivity decreased as the Si content increased, and increased with increasing temperature. However, the lattice thermal conductivity ranged from 0.54-0.72 Wm-1K-1 at 323-723 K without a specific dependence on the Si content and temperature.
Hence, as shown in Fig 7(a), the total thermal conductivity exhibited the highest values at 623 K for the specimens with y ≤ 0.3, while it increased with the temperature for the specimens with y = 0.4. Thus, increasing the Si content decreased the total thermal conductivity at a constant temperature, except at 723 K. Cu12Sb3.6Si0.4S13 exhibited the lowest thermal conductivity of 0.74-0.92 Wm-1K-1 at 323-623 K, while Cu12Sb3.7Si0.3S13 exhibited the lowest thermal conductivity of 0.85 Wm-1K-1 at 723 K. Kwak et al. [18] achieved the lowest thermal conductivity of 0.63-0.78 Wm-1K-1 at 323-723 K for the Bi-doped Cu12Sb3.6Bi0.4S13. Lu et al. [19] reported that the thermal conductivity of Te-doped Cu12Sb4-yTeyS13 decreased as the temperature increased, where the lattice thermal conductivity dominated. In their previous study [29], they estimated a low lattice thermal conductivity of 0.3-0.4 Wm-1K-1, and consequently, the thermal conductivity of 0.64-0.77 Wm-1K-1 at 300-723 K was obtained for Cu12Sb3TeS13. Levinsky et al. [20] observed that the lattice thermal conductivity of As-doped Cu12Sb4-yAsyS13 was very low (0.5 Wm-1K-1 at temperatures above 300 K), and reported that the substitution of As for the Sb sites did not enhance point defect scattering. Consequently, Cu12Sb2As2S13 exhibited a relatively high thermal conductivity of 1.2-1.3 Wm-1K-1 at 300-700 K.
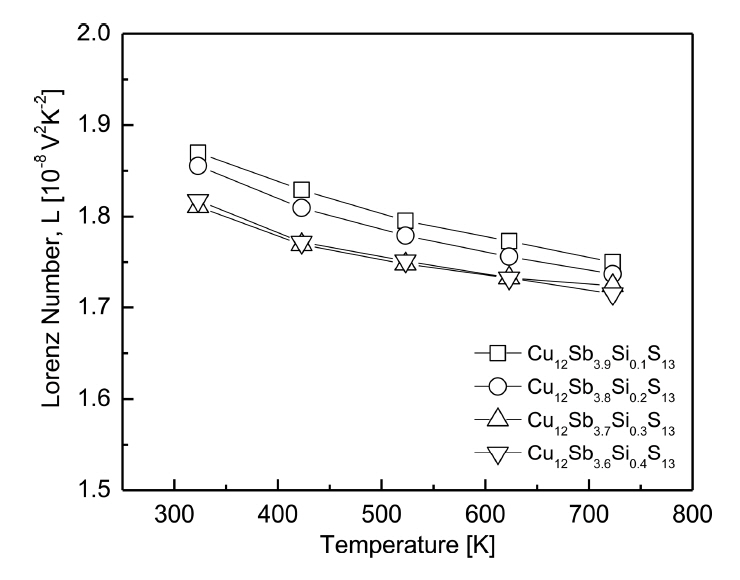
Figure 8 shows the temperature dependence of the Lorenz number for Cu12Sb4-ySiyS13. The Lorenz number decreased with increasing temperature in all the specimens, and it decreased as the Si content increased at a constant temperature. Theoretically, the Lorenz number ranges from (1.45-2.44) × 10-8 V2K-2 [30], where the smaller values indicate the approach of non-degenerate semiconductor behavior. As shown in Fig 8 and Table 1, the Lorenz number of the Si-doped tetrahedrites ranged from 1.81-1.86) × 10-8 V2K-2 at 323 K. Pi et al. [31] reported 1.76 × 10⁻⁸ V2K-2 at 323 K for undoped Cu12Sb4S13, while Kwak et al. [18] obtained similar values of (1.76-1.88) × 10-8 V2 K-2 at 323 K for Cu12Sb4-yBiyS13 (y = 0.1-0.4).
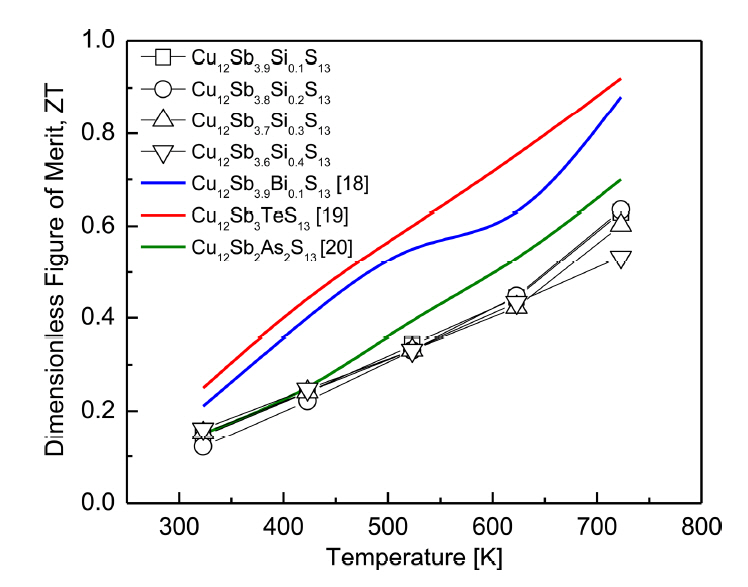
Figure 9 shows the dimensionless figure of merit ZT for Cu12Sb4-ySiyS13. The ZT increased as the temperature increased because of the increase in the power factor and the maintenance of low thermal conductivity. However, although the ZT did not change significantly with Si doping content, it decreased at high temperatures for y ≥ 0.3. For Cu12Sb3.8Si0.2S13, which exhibited a relatively low thermal conductivity (0.90 Wm-1K-1) and high power factor (0.79 mWm-1K-2). The maximum ZT = 0.63 was obtained at 723 K. In our previous study [18], Bi-doped Cu12Sb3.9Bi0.1S13 prepared by the MA-HP process achieved ZT = 0.88 at 723 K, due to the high power factor (1.02 mWm-1K-2) and low thermal conductivity (0.81 Wm-1K-1). Lu et al. [19] obtained ZT = 0.92 at 723 K for Te-doped Cu12Sb3TeS13 synthesized by the EM-HP method, and suggested that the substitution of Te for the Sb sites effectively improved the thermoelectric performance of tetrahedrite. Levinsky et al. [20] achieved ZT = 0.75 at 700 K for As-doped Cu12Sb2As2S13 produced by the EM-SPS process, and reported that As doping at the Sb sites did not affect the thermoelectric performance of tetrahedrite.
Compared with the other studies on Sb-site doping, the ZT of Si-doped tetrahedrites Cu12Sb4-ySiyS13 (y = 0.1-0.4) was relatively low, because of the low solubility limit of Si for Sb. Thus, the change in carrier concentration was insignificant, and the enhancement of phonon scattering by mass fluctuations was small. However, Si-doped tetrahedrites, which do not contain toxic and rare elements such as Te, As, and Bi, could be prepared using MA and HP, which are practical and relatively fast processes for solid-state synthesis and consolidation.
4. CONCLUSIONS
Densely-sintered Si-doped tetrahedrites Cu12Sb4-ySiyS13 (y = 0.1-0.4) were prepared using MA and HP. The tetrahedrite phase was successfully synthesized, and although no secondary phases were produced, residual Si elements appeared in the specimens whose Si content y ≥ 0.3. The lattice constant decreased due to Si doping, because of the substitution of Si with a smaller ionic radius at the Sb sites. All the specimens had positive Seebeck coefficient values, confirming that they were p-type semiconductors. The Seebeck coefficient increased with the Si doping level, but the electrical conductivity decreased. Cu12Sb3.9Si0.1S13 exhibited the highest power factor of 0.86 mWm-1K-2 at 723 K because of its high electrical conductivity. However, Cu12Sb3.8Si0.2S13 achieved a maximum ZT of 0.63 at 723 K, because of its lower thermal conductivity, despite the relatively low power factor.