


1. INTRODUCTION
Recently, there has been growing interest in various industries in energy harvesting technologies that use waste heat, and thermoelectric materials are being actively studied for that application because of their advantages, including eco-friendliness and low noise [1,2]. Because thermoelectric materials can directly convert waste heat into electricity, their energy use efficiency can be increased. The performance of thermoelectric materials is determined by the dimensionless figure of merit zT = S2σT/κtot, where S, σ, T, and κtot are the Seebeck coefficient, electrical conductivity, absolute temperature, and total thermal conductivity, respectively. Therefore, to improve zT, S and σ should be enHanced, whereas κtot should be reduced [3-6].
Oxide thermoelectric materials have attracted significant attention over the past few decades owing to their potential applications at high temperatures without a protective atmosphere, and excellent thermal and chemical durability [7-9]. However, because of their high thermal and low electrical conductivities, the thermoelectric performance of oxides in commercial applications is very poor. Recently, BiCuSeO, a p-type oxyselenide material, has attracted the attention of many researchers. Composed of alternate stacks of conducting layer [Cu2Se2]2− and insulating layer [Bi2O2]2+, BiCuSeO has an intrinsically low thermal conductivity [10]. A maximum zT of ~1.5 was achieved for BiCuSeO, which indicates that it can be used as a p-type thermoelectric module for thermoelectric devices [11]. Bi2O2Se can be considered an n-type counterpart of the p-type BiCuSeO. This is because, similar to BiCuSeO, Bi2O2Se consists of alternately stacked insulating [Bi2O2]2+ layers and conducting [Se]2− layers. The [Bi2O2]2+ layers can be considered phonon scattering regions, while the [Se]2− layers provide conduction pathways for electrons [12]. Bi2O2Se has a large S and intrinsically low thermal conductivity; however, because of its low carrier concentration and σ, the thermoelectric performance of Bi2O2Se is limited [13]. Recent studies have been conducted to improve the electrical transport properties of Bi2O2Se by various strategies, such as anion doping, cation doping, Ag addition, and Bi deficiency [14-19].
In this study, we investigated the thermoelectric properties of Cu-doped Bi2O2Se. The weighted mobility (μw) and quality factor (B) were calculated to validate the optimization of the power factor and zT.
2. EXPERIMENTAL DETAILS
CuxBi2O2Se (x = 0, 0.0025, 0.005, and 0.0075) polycrystalline samples were synthesized by a solid-state reaction using high-purity raw materials. Stoichiometric amounts of Bi (99.99%, KRTLab), Se (99.999%, 5N Plus), Bi2O3 (99.99%, Alfa Aesar), and Cu (99.999%, KRTLab) powders were weighed and mixed. The mixed raw materials were placed in a quartz tube and vacuum sealed. After melting at 600°C for 24 h, the mixture was cooled in a furnace to prepare an ingottype synthesized sample. The synthesized samples were ground into powder using a high-energy ball mill (SPEX 8000D, SPEX, USA). The samples were sintered by spark plasma sintering (SPS, SPS-1030, Sumitomo Coal Mining Co., Ltd., Japan) at 873 K for 10 min under a pressure of 50MPa. The relative densities of all sintered samples were over ~96%. X-ray diffraction analysis (XRD, D8 Discover, Bruker, USA) using Cu Kα1 radiation was performed to identify the phase formation behavior and the presence of a secondary phase. The σ and S values of each sample were measured using a thermoelectric evaluation system (ZEM-3M8, Advance Riko, Japan), under an atmosphere of He in the range of 300-800 K. The error margins for σ and S were less than 3% and 5%, respectively. Hall measurements were conducted in the Van der Pauw configuration using a Hall measurement system (HMS-5300, Ecopia, Korea) at 300 K. Using the Mott relationship, the density-of-state effective mass (md*) of each sample was calculated from S and Hall carrier concentrations. The thermal conductivity (κtot) of each sample was determined using the relationship κtot = αρCp, where α, ρ, and Cp are the thermal diffusivity, density, and heat capacity, respectively. The α value of each sample was measured using laser flash analysis (LFA, LFA457, Netzsch, Germany) from 300 to 800 K. The error margin for α was less than 7%.
We assumed that ρ and Cp were constant regardless of the addition of Cu, where ρ is the theoretical density of Bi2O2Se [20]. Because the amount of added Cu was very small, changes in the density and heat capacity due to the addition were considered negligible.
3. RESULTS AND DISCUSSION
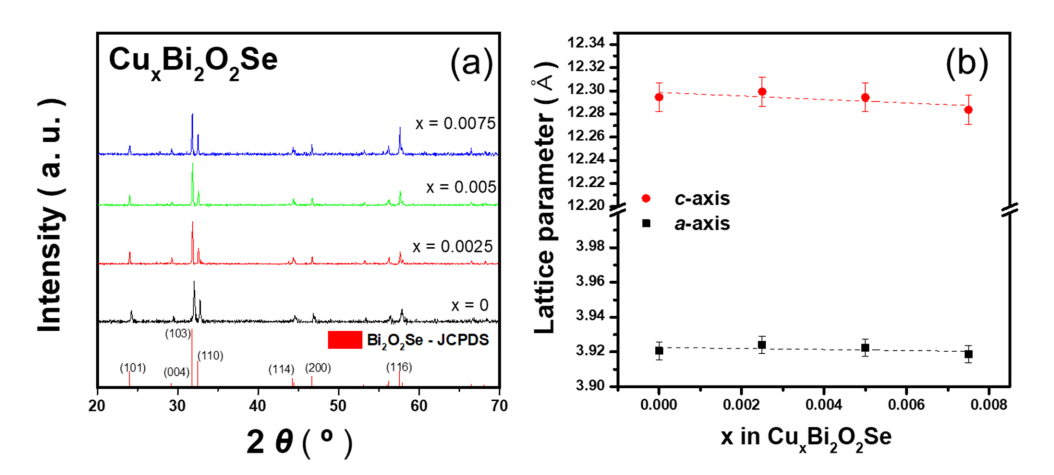
Figure 1(a) presents the XRD patterns of a series of Cudoped Bi2O2Se polycrystalline powder samples (CuxBi2O2Se, x = 0, 0.0025, 0.005, and 0.0075) at 300 K. As shown in Figure 1(a), tetragonal Bi2O2Se (Bi2O2Se, JCPDS #070-1549) was successfully synthesized. Figure 1(b) shows the calculated lattice parameters a and c from the XRD results with error bars. The (0 0 4) peak was used to calculate lattice parameter c, and the lattice parameter a was extracted from the (1 0 1) peak. The lattice parameters gradually decreased with Cu addition; however, significant differences were not observed between the samples (the variation between lattice parameters of the samples was within 0.2%). The gradual decrease in lattice parameters indicates that the added Cu atoms were successfully substituted at the Bi site. This is because of the difference in electronegativity; the electronegativity values of Cu, Bi, Se, and O are 1.90, 2.02, 2.55, and 3.44, respectively. In addition, if the added Cu atoms were interstitially doped, the lattice parameter would gradually increase. This evidence supports the substitution of Bi and Cu.
Figure 2(a) shows the temperature dependence of σ for the CuxBi2O2Se (x = 0, 0.0025, 0.005, and 0.0075) samples. At 300 K, σ of the pristine Bi2O2Se sample was 16.0 S/cm and it decreased to 12.8, 7.10, and 0.23 S/cm for x = 0.0025, 0.005, and 0.0075, respectively. At 790 K, σ of the pristine Bi2O2Se sample was 22.6 S/cm, and it decreased to 18.6, 10.1, and 4.81 S/cm for x = 0.0025, 0.005, and 0.0075, respectively. The σ value gradually decreased with increasing Cu content.
Figure 2(b) shows the measured S values as a function of temperature for the samples. At 300 K, the S value of the pristine Bi2O2Se sample was -232 μV/K, which improved to -288, -280, and -377 μV/K for x = 0.0025, 0.005, and 0.0075, respectively. At 790 K, the S value of the pristine Bi2O2Se sample was -316 μV/K, which improved to -328, -362, and -443 μV/K for x = 0.0025, 0.005, and 0.0075, respectively. The magnitude of S generally increased with increasing x over the entire temperature range. The band gap Eg of the samples was estimated from the maximum magnitude of the Seebeck coefficient, |S|max and the corresponding temperature Tmax, using the Goldsmid-Sharp empirical equation Eg = 2e|S|maxTmax [21] and are listed in Table 1. The estimated Eg values of the samples gradually increased with x, suggesting that carrier excitation was suppressed by the addition of Cu.
Figure 2(c) shows the calculated power factor of the samples as a function of temperature. The highest power factors were observed for the pristine Bi2O2Se sample in the high-temperature range. However, in the low-temperature range, the sample with x = 0.0025 exhibited the highest power factor value. Consequently, the power factor for the pristine Bi2O2Se sample of 0.086 mW m-1 K-2, which improved to 0.106 mW m-1 K-2 for x = 0.0025 at 300 K. However, the power factors of the other Cu-added samples decreased compared to that of the pristine sample, mainly owing to the significant decrease in σ. The contribution of the increase in the magnitude of S to the power factor was canceled out by the decrease in σ for these samples.
The Hall carrier concentration (nH) was measured at 300 K and is shown in Figure 3(a). The nH value of the pristine Bi2O2Se sample was -2.11 × 1018 cm-3 and changed to -8.95 × 10¹⁷, -4.81 × 10¹⁷, and -2.37 × 1017 cm-3 for x = 0.0025, 0.005, and 0.0075, respectively. The nH value decreased exponentially with increasing Cu content. This result is in accordance with the band gap estimated using the Goldsmid-Sharp equation. Generally, electron carrier excitation is restricted to large-bandgap materials. Furthermore, nH is closely related to S according to the Mott relationship [22].
where k, h, e, and n are the Boltzmann constant, Planck’s constant, elementary charge, and carrier concentration, respectively. Generally, an increase in |S| is expected as n decreases, because |S| and n are inversely proportional to each other. Therefore, the increase in |S| was mainly attributed to the decrease in nH. The Hall mobility (μH) was measured at 300 K, as shown in Figure 3(b). The μH values of the samples were 53.3, 106, 120 and 48.6 cm2/Vs for x = 0, 0.0025, 0.005, and 0.0075, respectively. The μH values increased up to x = 0.005 but decreased at x = 0.0075.
Figure 3(c) shows |S| as a function of nH (Pisarenko plot). The inset in Figure 3(c) shows md* calculated from nH and S measured at 300 K for the Mott relationship in Equation (1) as a function of x in CuxBi2O2Se (x = 0, 0.0025, 0.005, and 0.0075). The dotted lines in Figure 3(c) indicate the Mott relationship functions, wherein, md* were calculated as variables, for the Cu-added Bi2O2Se. The md* value was highest at 0.190 m0 (m0 is the electron rest mass) for pristine Bi2O2Se and gradually decreased with the addition of Cu to 0.133, 0.0858, and 0.0718 m0 for x = 0.0025, 0.005, and 0.0075, respectively. The continuous decrease in md* with the Cu addition implies that the band structure was unfavorably modified by the Cu addition.
Figures 4(a) and 4(b) show κtot and lattice thermal conductivity (κlat) as a function of temperature for the CuxBi2O2Se (x = 0, 0.0025, 0.005, and 0.0075) samples. The inset of Figure 4(a) shows the electronic thermal conductivity (κele) of the samples, calculated using the Wiedemann-Franz law [23]: κele = LσT, where L is the Lorenz number. The κlat value was obtained by subtracting κele from κtot. Because the electronic contribution to κtot was considerably small (the measured σ was less than 30 S/cm), κtot and κlat exhibited almost identical values. The κtot and κlat values for the Cucontaining samples were lower than those of the pristine Bi2O2Se sample. The κlat values of the samples were 1.59, 1.31, 1.31, and 1.16 W/mK at 300 K and 0.829, 0.690, 0.699 and 0.680 W/mK at 790 K for x = 0, 0.0025, 0.005, and 0.0075, respectively. Further, κlat generally decreased with an increase in Cu content, which is due to point defect phonon scattering via Cu addition. The decrease in the lattice parameters a and c for the Cu-added samples implies lattice distortion in their crystal structure, which contributed to the decrease in κlat.
Figure 5(a) shows the temperature dependence of zT for the CuxBi2O2Se (x = 0, 0.0025, 0.005, and 0.0075) samples, calculated using the σ, S and κtot values. The zT value, enHanced from 0.206 to 0.222 for x = 0.0025 compared to that of the pristine Bi2O2Se sample at 790 K, owing to a decrease in κtot and a small change in the power factor. Note that the error margin for zT would be less than 15%. However, the zT value of the other Cu-added samples decreased compared with that of the pristine sample, mainly because of the large decrease in the power factor. Consequently, a maximum zT of 0.222 at 790 K was obtained for the sample with x = 0.0025.
The weighted mobility (μw) of each sample was calculated using the measured σ and S, as shown in Figure 5(b). The μw value is theoretically related to the maximum electrical performance of the thermoelectric material. Further, μw can be calculated from an analytical expression that estimates the exact Drude-Sommerfeld free electron model for |S| > 20 μV/ K [23]:
where me is the mass of the electron. At 300 K, the μw values of the samples were 10.5, 15.3, 7.95, and 0.794 cm2/Vs for x = 0, 0.0025, 0.005, and 0.0075, respectively. The μw value increased initially for x = 0.0025 and decreased with Cu content for x = 0.005 and 0.0075, closely following the power factor trend at 300 K. The power factor for x = 0.0025 at 300 K increased only by ~23%, and it can be further improved by appropriate nH tuning. Figure 5(c) shows the dimensionless B of each sample determined from μw and κlat. The B value of each sample was calculated as follows [23]:
B is relative to the maximum zT that can be achieved when nH is optimized [24,25]. The values of B at 300 K were 0.00450, 0.00862, 0.00434, and 4.91 × 10⁻⁴ for x = 0, 0.0025, 0.005, and 0.0075, respectively. The B value increased at x = 0.0025 and then decreased with the addition of Cu, which is in accordance with the zT trend at 300 K. In addition, the sample with x = 0.0025 exhibited a maximum B value of 0.0964 at 790 K, and the power factor improvement for x = 0.0025 could be greatest at 790 K. Therefore, further enhancement of zT can be achieved by optimizing nH for the Cu0.0025Bi2O2Se (x = 0.0025) composition.
Figure 5(d) presents the calculated nH-dependent zT for CuxBi2O2Se (x = 0, 0.0025, 0.005, and 0.0075) at room temperature. The experimental zT measurements are indicated by symbols. The theoretical peak zT of the Cudoped samples estimated using the single parabolic band model was significantly greater than that of the Bi2O2Se sample [26]. Among the doped samples, the theoretical zT of Cu0.0025Bi2O2Se was the highest in all nH regions. The zT value of Cu0.0025Bi2O2Se can be further improved by tunning nH from 8.9 × 10¹⁷ to 4.7 × 1018 cm-3. For instance, the zT of the Cu0.0025Bi2O2Se sample can reach 0.034 at nH of approximately 4.7 × 1018 cm-3, which is approximately 36% higher than that of 0.025 at 300 K.
4. CONCLUSION
In this study, we investigated the electrical transport and thermoelectric properties of Cu-doped n-type Bi2O2Se (CuxBi2O2Se with x = 0, 0.0025, 0.005, and 0.0075). Tetragonal Bi2O2Se was successfully synthesized, and the lattice parameters a and c gradually decreased with Cu addition. Over the entire temperature range, σ gradually decreased and the magnitude of the S gradually increased with increasing x content, according to the trade-off relationship between the parameters. Consequently, at 300 K, a maximum power factor of 0.106 mW m-1 K-2 was obtained for the sample with x = 0.0025, owing to the increase in the magnitude of S. The Hall carrier concentration decreased exponentially with increasing Cu content, which is mainly attributed to the possible enlargement of the band gap of the Cu-added samples. The κlat value decreased with increasing x, which was attributed to the point defect phonon scattering caused by the Cu addition. Therefore, a maximum zT of 0.222 was achieved at 790 K for the Cu0.0025Bi2O2Se (x = 0.0025) sample, which was approximately 8% higher than that of the pristine Bi2O2Se sample.