


1. INTRODUCTION
Hydrogen sulfide (H2S) is a flammable, colorless, toxic, and corrosive gas [1]. It is generated from certain industrial activities and the degradation of domestic human waste [2,3]. In addition, it is generated by the bacterial breakdown of some organic matter in the absence of oxygen [4]. Exposure to low concentrations of H2S gas causes eye irritation and damage to the respiratory and central nervous systems [5], and prolonged exposure to ppb levels of H2S may increase the risk of central nervous and respiratory symptoms [6]. Exposure to high H2S levels (100 ppm) leads to sudden collapse with difficulty breathing, and is fatal in most cases [7]. Hence, the threshold limit value (TLV) for H2S exposure for 8 h was set to 10 ppm [8]. In addition to its detrimental effects, H2S can act as a biomarker. For example, – if the H2S concentration is > 250 ppb in a person’s exhaled breath, it indicates the presence of periodontal disease [9]. Accordingly, the accurate detection of H2S is important from different perspectives.
Electrochemical, optical, piezoelectric, and resistive-based gas sensors are the gas sensors primarily used for H2S gas-sensing [10,11]. Among them, metal oxide gas sensors, whose resistance changes in a H2S gas environment, are among the most popular because of their high sensitivity, fast response, high stability, simple operation, and low cost [12,13]. SnO2, ZnO, Fe2O3, and In2O3 are among the most commonly used metal oxides in sensing studies [14].
2 dimensional (2D) materials are also promising candidates for gas sensing studies [15]. They not only have unique electrical properties but also offer a high surface area for incoming gas molecules [16,17]. 2D metal oxides such as ZnO nanoflakes [18], Fe2O3 nanosheets [19], 2D transition metal dichalcogenides such as WS2 [20] and MoS2 [21] and 2D metal sulfides such as SnS2 [22, 23] are increasingly used in this area. As an example, Zhang et al. [24], used different amounts of Ce as a dopant in ZnO porous nanosheets for an aniline sensing application. It was found that a 1 at% Ce doped ZnO sensor exhibited a high response of 15.1 to 100 ppm aniline at room temperature.
In addition, CuO-based gas sensors are primarily used for H2S gas sensing [25]. However, less attention has been paid to other semiconducting metal oxides, including rare earth oxides such as cerium oxide (CeO2). CeO2 has a high oxygen storage feature thanks to its rich oxygen vacancies and low redox potential, between Ce3+ and Ce4+. It is currently employed in three-way catalysts in cars to decrease the emission of pollutant gases [27,27]. Gd+3-doped CeO2 has good oxygen ion conductivity and hence, is used in solid oxide fuel cells [28]. Moreover, CeO2 with good absorption of ultraviolet (UV) light is used as a UV shielding and blocking material [29].
There are some studies in the literature regarding the gas sensing applications of CeO2. Pt-decorated CeO2 nanowires (NWs) have been used for CO detection [30]. Motaung et al. used CeO2-SnO2 nanocomposites for H2 gas sensing. Ahmad et al. [31] used ZnO-doped CeO2 to detect nitroaniline gas. Abud et al. [32] used Gd-doped (7 wt. %) CeO2 for CO2 gas sensing and found that it had better performance relative to a pristine CeO2 gas sensor. Zakaria et al. [33] used Zr- and V-doped CeO2/TiO2 core-shell gas sensors for ethanol sensing. However, less attention has been paid to the H2S sensing properties of CeO2. Among the limited studies, Li et al. [34] used CeO2 nanowires for H2S sensing at 25°C, and Oosthuizen et al. [35] used CeO2 gas sensors for sensing both NO2 and H2S gases.
In addition, Gd doping can enhance the gas sensing ability of compounds. For example, it has been demonstrated that 4 wt. % Gd-doped ZnO had a better xylene response than undoped ZnO [36]. In another study, a Gd-doped WO3/RGO nanocomposite exhibited high sensitivity and selectivity for acetone [37]. Fareed et al. [38] reported the enhanced oxygen-sensing properties of a Gd-doped Co3O4 gas sensor. Gd-doped WO3 and Gd-doped WO3/TiO2 nanocomposites exhibited an improved response to NH3 gas [39]. In addition, a 3 % Gd-doped SnO2 gas sensor displayed a large sensor response toward ethanol, which was approximately 26 times higher than that of the pristine sensor [40]. The Gd-doped CeO2 (GDC) gas sensor exhibited good acetone sensing performance [41].
Inspired by the lack of studies on the H2S-sensing feature of GDC, we investigated the H2S-sensing characteristics of pristine CeO2 and GDC nanoparticles (NPs). The results demonstrated that the GDC gas sensor had a higher H2S gas-sensing performance than pristine CeO2, implying the promising ability of Gd doping to enhance the H2S gas response.
2. EXPERIMENTAL
2.1 Materials
Commercial CeO2 (99.9%, Daejung Chemicals & Metals Company, LTD) and GDC (Ce0.9Gd0.1O2, Rhodia, ULSA grade) NPs were used as the sensing materials in this study.
2.2. Materials Characterization
The morphology, chemical composition, phase and chemical states of the synthesized powders were studied by Transmission electron microscopy (TEM; Talos F200X, FEI), energy-dispersive X-ray spectroscope (EDS; Talos F200X, FEI), X-ray diffraction (XRD, SmartLab, Rigaku) and X-ray photoelectron spectroscopy (XPS; Thermo Fisher Scientific Co.), respectively.
2.3. Gas Sensor Tests
Initially, a bilayer (Au/Ti) electrode was sputtered on the samples, already on a substrate. The fabricated gas sensors were put inside a temperature-controlled gas chamber in a tubular furnace. The sensing properties of the sensors were evaluated at different temperatures. Highly pure gases in certificate cylinders were mixed with synthetic air to prepare the target gas with the desired concentration using mass flow controllers (MFCs). The flow rate was fixed at 500 sccm using MFCs. The resistance of the sensor in air (Ra) and in the presence of the target gas (Rg) was recorded using a Keithley 2400 source meter connected to a PC, and the sensor response was evaluated as R = Ra/Rg. The sensing behavior was also measured in humid air (relative humidity (RH) of 0, 30 and 60 %, measured at 25°C). The actual temperature and RH values of the mixed humid gas was measured before loading into the gas chamber by a sensitive RH probe.
3. RESULTS AND DISCUSSION
3.1. Morphological, Structural, and Chemical Studies
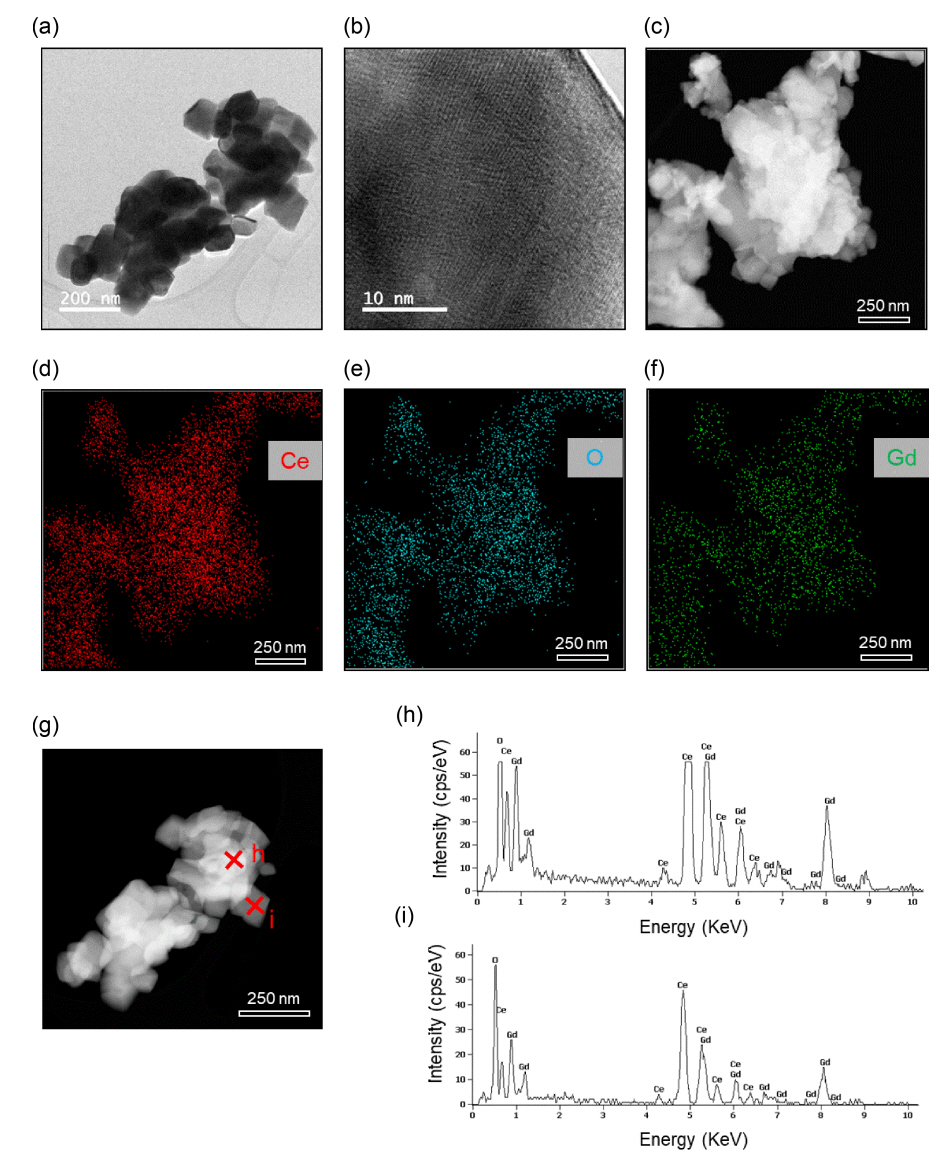
Fig 1(a) shows a typical TEM image of GDC NPs with sizes of approximately 100 nm. Fig 1(b) presents a high-resolution TEM (HRTEM) image of GDC and shows the good crystallinity of the GDC. Fig 1(c)–(f) show the TEM-EDS mapping analyses of the GDC NPs. All expected elements, namely Ce (Fig 1(d)), O (Fig 1(e)), and Gd (Fig 1(f)), were present in the analyzed material, with uniform distribution across the material. Further chemical analyses were performed using TEM-EDS point analysis, as shown in Fig 1(g)–(i) for the GDC NPs. Chemical analysis of GDC was recorded at two different points, as shown in Fig 1(h)–(i). Table 1 shows the results of EDS analysis at the indicated points. For point (h), the weight percentages (wt. %) of the Ce, O, and Gd elements were 76.53, 14.84, and 9.53 %, respectively. In addition, for point (i), the values were 71.28, 17.92, and 10.80 %, respectively. Negligible variations were observed between the two points, demonstrating the excellent chemical homogeneity of the GDC NPs used in this study.
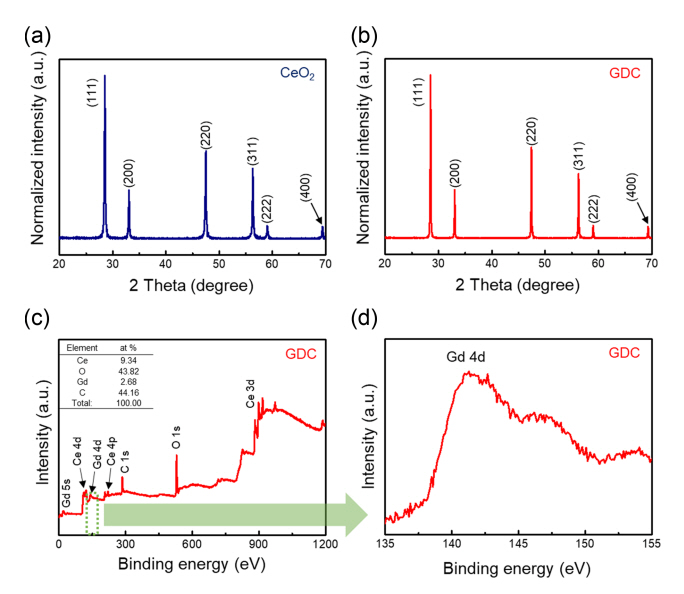
In addition, the weight percentage of Gd3+ was approximately 10 %. Fig 2(a) exhibits the XRD pattern of the pristine CeO2 NPs, with sharp peaks related to the (111), (200), (220), (311), (222), and (400) crystalline planes of CeO2 (JCPDS File No. 65-2975) [42]. In addition, Fig 2(b) reveals the XRD pattern of the GDC NPs, with a peak similar to that observed for pristine CeO2 NPs. No peaks related to Gd2O3 were observed, reflecting the incorporation of Gd3+ ions into the CeO2 crystal lattice. Fig 2(c) shows an XPS survey of the GDC NPs. It shows the presence of all the peaks, namely, O, Gd, Ce, and C (from ambient). In addition, Fig 2(d) reveals the Gd 4d core-level region, indicating the presence of two Gd peaks at approximately 145.9 eV and 150.8 eV, which corresponds to the Gd 4d5/2 and 4d3/2 energy states, similar to previous results [43].
3.2. Gas Sensing Studies
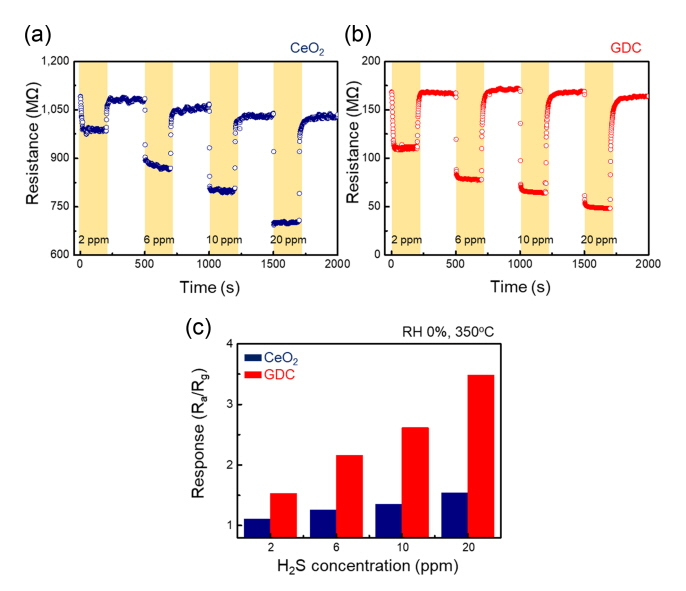
After a series of preliminary measurements, 350°C was found to be the optimal sensing temperature for both gas sensors, and other tests were performed at this temperature. Fig 3(a) and (b) show the real time resistance plots of the pristine CeO2 and GDC gas sensors, respectively, at 2, 6, 10, and 20 ppm H2S at 350 °C. For both gas sensors, the resistances decreased after H2S gas injection, indicating the n-type nature of both gas sensors, arising from the n-type conductivity of the CeO2 NPs. In addition, the resistance of the GDC gas sensor was significantly lower than that of the pristine CeO2 gas sensor. Fig 3(c) compares the responses of gas sensors to various concentrations of H2S gas. The responses of the pristine CeO2 gas sensor to 2, 6, 10, and 20 ppm H2S gas were 1.108, 1.255, 1.352, and 1.542, respectively, while those of the GDC gas sensor to the aforementioned H2S concentrations were 1.532, 2.162, 2.618, and 3.489, respectively. Hence, the GDC gas sensor had a greater response to H2S gas than the pristine CeO2 gas sensor, reflecting the promising effects of Gd doping for H2S gas sensing.
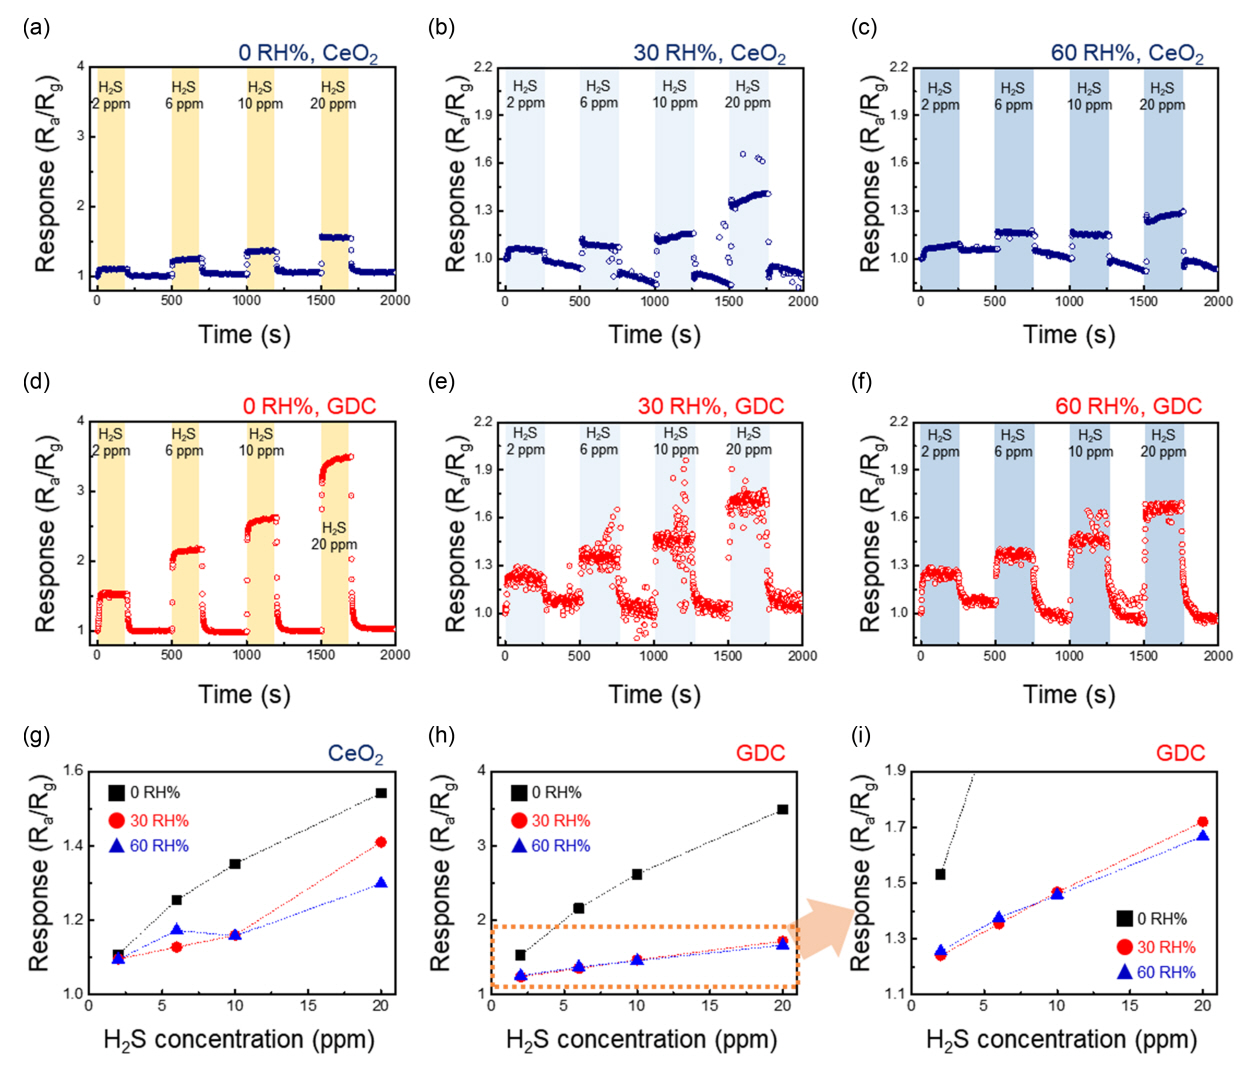
Fig 4(a)–(c) present the real time response curves of the pristine CeO2 sensor to various concentrations of H2S gas in the presence of 0, 30, and 60 % relative humidity (RH), respectively. In addition, Fig 4(d)–(f) show the time-dependent response curves of the GDC gas sensor for different concentrations of H2S gas in the presence of 0, 30, and 60 % RH, respectively. To gain a better insight, we plotted the response of the CeO2 and GDC gas sensors in the presence of humidity, as revealed in Fig 4(g) and (f), respectively. Fig 4(i) shows an enlarged view of the part indicated in Fig 4(h). In both cases, the responses decreased in humid air. In humid air, water molecules are adsorbed onto the surface of the gas sensor, limiting the number of sites available for the adsorption of incoming H2S gas molecules [44].
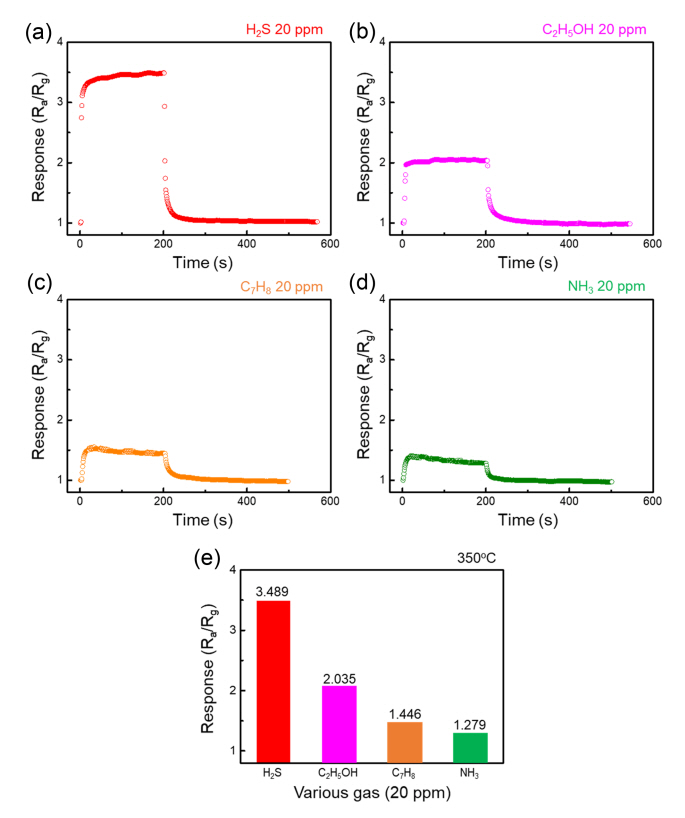
Next, we evaluated the selectivity of the GDC gas sensor. To this end, we exposed it to 20 ppm H2S, C2H5OH, C7H8, and NH3 gases at 350 °C, as shown in Fig 5(a)–(d), respectively. The corresponding selectivity pattern for the GDC gas sensor is given in Fig 5(e). The responses to 20 ppm H2S, C2H5OH, C7H8, and NH3 were 3.489, 2.035, 1.446, and 1.279, respectively. Hence, the response to H2S was more than that of the other gases, and the sensor showed selectivity towards H2S gas.
3.3. Proposed Gas Sensing Mechanism
Initially, in dry and fresh air, oxygen molecules are adsorbed on the surface of the sensing materials, and because of high electron affinity, take the electrons from the conduction band of CeO2 and thus will be converted to ionic species such as O2-, O-, and O2- as follows [45]:
This results in the formation of an electron depletion layer (EDL) on CeO2 in air. After exposure to H2S gas, the following reaction is likely to occur [45,46]:
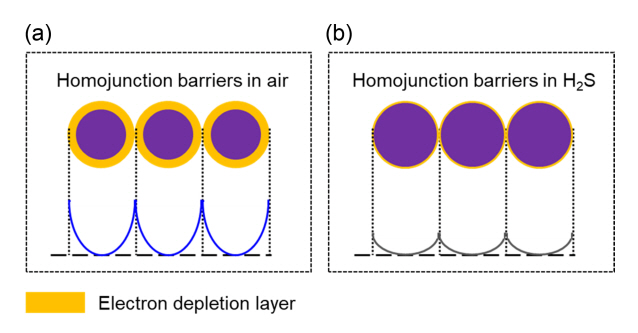
H2S gas reacts with the already adsorbed oxygen ionic species, causing the release of electrons from the surface of the gas sensor. This leads to narrowing of the EDL, which results in a decrease in resistance, contributing to the sensing signal. Moreover, in the contact areas between the CeO2 NPs, homojunction barriers are formed in air, which can act as barriers to the flow of electrons from one grain to another (Fig 6(a)). Upon exposure to H2S gas, the released electrons are transferred back to the sensor. This results in a decrease in the height of the homojunction barriers in the H2S gas atmosphere, contributing to the sensing signal (Fig 6(b)).
A higher response was observed with the GDC sensor. In addition to the abovementioned mechanisms, namely the modulation of the EDL and homojunction barriers, other factors should be considered. As shown by the characterization studies, the GDC gas sensors had approximately 10 wt. % Gd3+ in its composition. The addition of Gd3+ to CeO2 can generate oxygen vacancy defects, which can affect the sensing properties of the GDC. Gd3+ doping of CeO2 can introduce vacancies in the oxygen sub-lattice as charge-compensating defects [47]:
Thus, oxygen vacancies play a role as favourable adsorption sites for oxygen molecules, and hence, more oxygen will be adsorbed on the surface of the gas sensor and eventually more reactions with H2S can lead to a higher sensitivity GDC gas sensor.
The selectivity to H2S gas can be attributed to the sensing temperature, a higher reactivity of H2S relative to other gases and the small bond energy of H-SH. The bond energy of HSH in H2S is 381 kJ/mol, while the bond energy of H-NH2 in NH3 is 435 kJ/mol, and the bond energy of H-OC2H5 in C2H5OH is 635 kJ/mol; thus, H-SH can be easily broken to react with the absorbed oxygen ions [46].
4. CONCLUSIONS
This study analyzed the H2S gas-sensing characteristics of pristine CeO2 and GDC NPs. Different techniques were used to characterize the powders and to gain insights into their morphologies, chemical compositions, and phases. The H2S gas-sensing studies revealed that the GDC gas sensor had a higher response to H2S gas than pristine CeO2 NPs, demonstrating the promising effects of Gd doping on the H2S gas-sensing properties of CeO2 NPs. Moreover, the GDC sensor exhibited a higher selectivity to H2S gas than other interfering gases, such as ethanol, ammonia, and toluene, reflecting its selectivity to H2S gas. The enhanced response of the GDC gas sensor was related to the generation of oxygen defects as a result of Gd doping. Future studies should focus on noble metal decoration to further enhance the gas sensing properties of the GDC.