


1. INTRODUCTION
Metal hydride storage is advantageous over pressure storage and cryogenic storage since metal hydrides have a higher volumetric capacity and metal hydride storage is safer because low pressures are involved in the hydrogen uptake and release processes [1].
Magnesium has a high hydrogen storage capacity (7.6 wt%), is of low cost, and is abundant in the earth’s crust. However, it reacts at a very low rate with hydrogen. Many studies to raise the hydrogen uptake and release rates of magnesium have been carried out by alloying magnesium (Mg) or magnesium hydride (MgH2) with metallic elements [2-5], by mixing Mg or MgH2 with compounds [6-11], and by synthesizing Mg-containing compounds [12-16].
Yavari et al. [17] mechanically alloyed a mixture of MgH2 with a few % FeF3 and found the fluoride transfer reaction occurred from Fe to Mg, leading to the formation of Fe nanoparticles (and protective intergranular MgF2) within a nanograined MgH2 powder. The influence of various halide additives milled with magnesium hydride (MgH2) on its decomposition temperature was studied by Malka et al. [18]. Halide additives milled with magnesium hydride exhibited a strong catalytic effect on the MgH2 decomposition process and fluorides were found to be better catalyst than chlorides [18]. The authors reported that of the halides studied, TaF5 and VCl3 were the best catalysts for the hydrogen release reaction of magnesium hydride. 7 wt% of various metal halides (ZrF4, TaF5, NbF5, or TiCl3) was added to magnesium hydride by ball milling by Malka et al. [19], and the influence of these additives on the kinetics of hydrogen uptake and release was examined. They reported that the catalytic effect of metal halides on the Mg hydrogen uptake/release process resulted from the formation of pure transition metal and/or the MgF2 phase.
In this work, TaF5 and VCl3 were selected as the additives to raise the hydrogen uptake and release rates of Mg, because the addition of TaF5 or VCl3 greatly increased the reaction rates of Mg with hydrogen and the hydrogen storage capacity of Mg in our previous work [20,21]. The total contents of the additives were not more than 10 wt% since too large contents would decrease the fraction of Mg and thus the hydrogen storage capacity of the alloys. Samples with compositions of 97.5 wt% Mg+1.25 wt% TaF5+1.25 wt% VCl3, 95 wt% Mg+2.5 wt% TaF5+2.5 wt% VCl3, and 90 wt% Mg+5 wt% TaF5+5 wt% VCl3 were prepared by milling in a hydrogen atmosphere (reactive mechanical grinding). Their hydrogen uptake and release properties were then examined. We named these samples Mg-1.25TaF5-1.25VCl3, Mg-2.5TaF5-2.5VCl3, and Mg-5TaF5-5VCl3, respectively.
2. EXPERIMENTAL DETAILS
Pure Mg powder (particle size 74-149 μm, purity 99.6%, Alfa Aesar), TaF5 (Tantalum (V) fluoride, purity 98%, Aldrich), and VCl3 (Vanadium (III) chloride, purity 97%, Aldrich) were used as the starting materials.
A planetary ball mill (Planetary Mono Mill; Pulverisette 6, Fritsch) with a mill container of 250 ml volume was used for the reactive mechanical grinding. The sample (total weight = 8 g) to ball weight (105 hardened steel balls, total weight = 360 g) ratio was 1/45. All sample handling was performed in an Ar atmosphere. The disc revolution speed was 250 rpm. The reactive mechanical grinding was performed in high purity hydrogen gas (≈ 12 bar) for 6 h. Hydrogen was refilled every two hours.
The quantity of absorbed or released hydrogen was measured as a function of time by a volumetric method, using a Sieverts’ type hydrogen uptake and release apparatus described previously [22]. Hydrogen pressures were kept nearly constant during the hydrogen uptake and release measurements by using a back-pressure regulator. 0.5 g of the samples was used to measure the quantity of absorbed or released hydrogen as the reaction time increased.
Samples after reactive mechanical grinding and after hydrogen uptake-release cycling were characterized by X-ray diffraction (XRD) with Cu Kα radiation at a scan speed of 4°/min, using a Rigaku D/MAX 2500 powder diffractometer. The MDI JADE 5.0 program was used to analyze the XRD patterns. The scanning electron microscope (SEM) micrographs of the powders were obtained using a JSM-5900 SEM operated at 20 kV.
3. RESULTS AND DISCUSSION
Figure 1 shows the XRD pattern of Mg-2.5TaF5-2.5VCl3 after reactive mechanical grinding. The sample contains Mg, β-MgH2, and very small amounts of γ-MgH2, V, and TaF5. The relatively high background suggests that the samples are somewhat noncrystalline. β-MgH2 and γ-MgH2 are formed by the reaction of Mg with hydrogen during reactive mechanical grinding. It was reported that MgCl2 is formed from a reaction between Mg and VCl3 [18]. The reaction of Mg with VCl3 is considered to form MgCl2 and V. The peaks of MgCl2 are hard to observe probably due to the extremely small quantity. The XRD patterns of Mg-xTaF5-xVCl3 (x=1.25 and 5) after reactive mechanical grinding were similar to the XRD pattern of Mg-2.5TaF5-2.5VCl3 after reactive mechanical grinding.
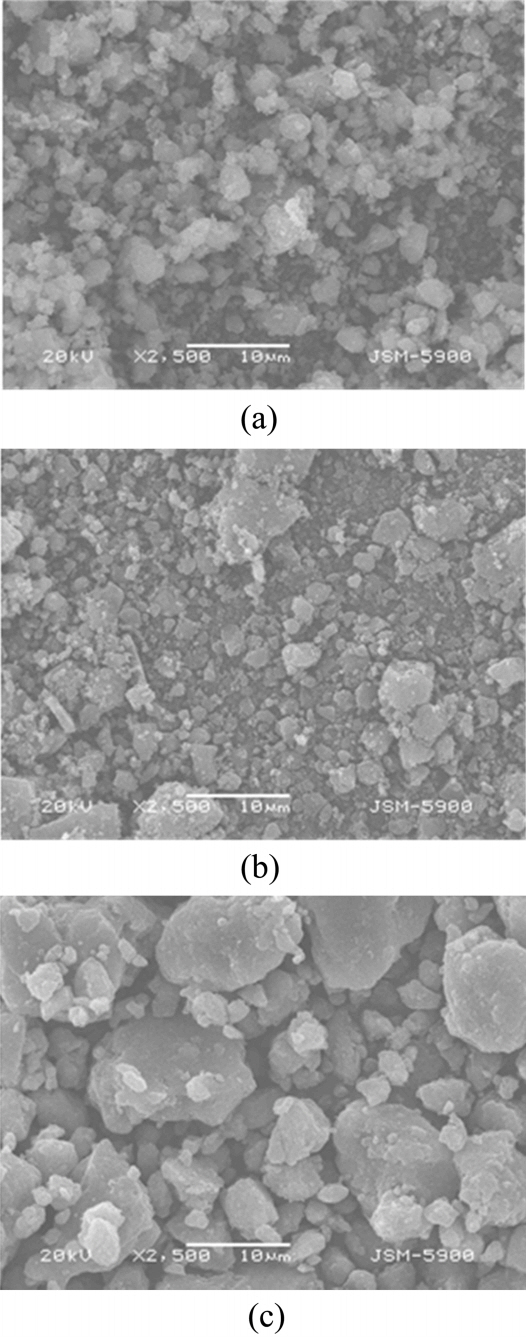
The SEM micrographs of Mg-xTaF5-xVCl3 (x=1.25, 2.5, and 5) after reactive mechanical grinding are shown in Fig. 2. The particle sizes are not homogeneous. Mg-2.5TaF5-2.5VCl3 has the smallest particles, followed in order by Mg-1.25TaF5-1.25VCl3 and Mg-5TaF5-5VCl3. The particles of Mg-5TaF5-5VCl3 are much larger than those of Mg-1.25TaF5-1.25VCl3 and Mg-2.5TaF5-2.5VCl3.
Figure 3 presents the hydrogen content versus time curves for the as-milled Mg-xTaF5-xVCl3 (x=1.25, 2.5, and 5) when the sample was heated at a heating rate of 5-6 K/min. Mg-1.25TaF5-1.25VCl3 releases hydrogen very slowly from room temperature to 538 K, quite rapidly from 538 K to 619 K, and then slowly from 619 K to 622 K. The hydrogen release from Mg-2.5TaF5-2.5VCl3 occurs in two stages. Mg-2.5TaF5-2.5VCl3 releases hydrogen very slowly from room temperature to 613 K. From 613 K, Mg-2.5TaF5-2.5VCl3 releases hydrogen quite rapidly and the temperature of the reactor decreases until 597 K. After a plateau between 608 K and 626 K, Mg-2.5TaF5-2.5VCl3 releases hydrogen quite rapidly, the temperature being kept constant at 626 K. The hydrogen release rate after the plateau is slightly lower than that in the first stage of hydrogen release. The occurrence of the hydrogen release from Mg-2.5TaF5-2.5VCl3 in two stages is believed to result from the small particle sizes of this sample, as exhibited in Fig. 2 (b). In the first stage, the hydrogen release rate is high since the particles are small. While hydrogen is released rapidly, the temperature of the sample decreases because the endothermic heat is larger than the heat supplied by the heating. The sample waits for the increase in temperature by the heating: during this time the curve exhibits a plateau. Then, when the sample is heated to 626 K, the sample begins to release hydrogen and continues to release hydrogen as the temperature of the sample is maintained at 626 K (the second stage). Mg-5TaF5-5VCl3 releases hydrogen very slowly from room temperature to 642 K and as the temperature is kept constant, hydrogen is released quite rapidly. Mg-5TaF5-5VCl3 then releases hydrogen slowly. The temperatures at which the as-milled Mg-xTaF5-xVCl3 (x=1.25, 2.5, and 5) begin to release hydrogen quite rapidly are 538, 613, and 642 K, respectively. The total amounts of released hydrogen are 3.47, 4.00, and 1.22 wt%, indicating that Mg-2.5TaF5-2.5VCl3 has the largest total amount of released hydrogen.
The amount of absorbed hydrogen, Ha, and the amount of released hydrogen, Hd, were defined with respect to the sample weight. Ha and Hd were expressed in the unit of wt% H.
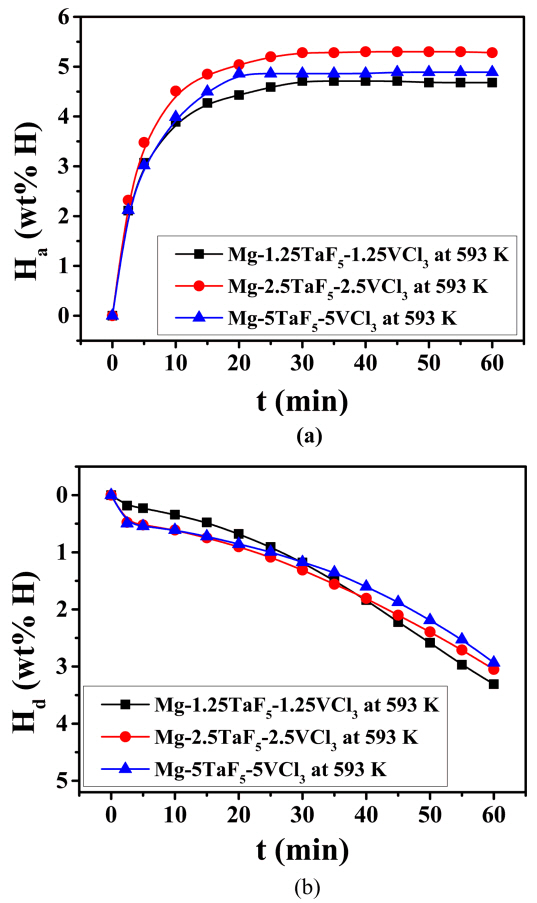
The Ha versus t curves in 12 bar H2 and the Hd versus t curves in 1.0 bar H2 at 593 K in the number of cycles, n, of 1 for milled Mg and Mg-xTaF5-xVCl3 (x=1.25, 2.5, and 5) are shown in Fig. 4. The as-milled Mg absorbs hydrogen extremely slowly. The Mg-xTaF5-xVCl3 (x=1.25, 2.5, or 5) have much higher initial hydrogen uptake rates and much larger amounts of hydrogen absorbed for 60 min than the as-milled Mg [23]. The as-milled Mg does not release hydrogen [23]. Mg-xTaF5-xVCl3 (x=1.25, 2.5, or 5) have very slightly higher initial hydrogen release rates and larger amounts of hydrogen released for 60 min than the as-milled Mg. The reactive mechanical grinding of Mg with TaF5 and VCl3 is considered to increase the hydrogen uptake and release rates by forming imperfections (leading to easier nucleation), creating new clean surfaces (leading to an increase in the reactivity of Mg particles with hydrogen), and decreasing the Mg particle size (leading to a decrease in the diffusion distances of hydrogen atoms). Mg-1.25TaF5-1.25VCl3 has the highest initial hydrogen uptake rate, followed in order by Mg-2.5TaF5-2.5VCl3 and Mg-5TaF5-5VCl3. Mg-2.5TaF5-2.5VCl3 has the largest amount of hydrogen absorbed for 60 min, followed in order by Mg-1.25TaF5-1.25VCl3 and Mg-5TaF5-5VCl3. In n=1, Mg-2.5TaF5-2.5VCl3 has quite a high effective hydrogen storage capacity (the amount of hydrogen absorbed for 60 min) of 5.86 wt%. In n=1, Mg-2.5TaF5-2.5VCl3 absorbed 4.23 wt% H for 5 min, 5.23 wt% H for 10 min, and 5.86 wt% H for 60 min at 593 K in 12 bar H2. After reactive mechanical grinding, Mg-2.5TaF5-2.5VCl3 has the smallest particles, followed in order by Mg-1.25TaF5-1.25VCl3 and Mg-5TaF5-5VCl3, whose particles are much larger than those of Mg-2.5TaF5-2.5VCl3 and Mg-1.25TaF5-1.25VCl3, as shown in Fig. 2. As the particle size decreases, the Ha for 60 min of the sample becomes larger. Mg-5TaF5-5VCl3 has the highest initial hydrogen release rate, followed in order by Mg-2.5TaF5-2.5VCl3 and Mg-1.25TaF5-1.25VCl3. Mg-1.25TaF5-1.25VCl3 has the largest amount of hydrogen released for 60 min, followed in order by Mg-2.5TaF5-2.5VCl3 and Mg-5TaF5-5VCl3.
The variations in Ha for 5 min and 60 min at 593 K in 12 bar H2 with the number of cycles, n, for Mg-xTaF5-xVCl3 (x=1.25, 2.5, and 5) are shown in Fig. 5. In n=1, Mg-2.5TaF5-2.5VCl3 has the largest values in Ha for 5 min and 60 min, followed in order by Mg-1.25TaF5-1.25VCl3 and Mg-5TaF5-5VCl3. From n=1 to n=4, the values of Ha for 5 min and 60 min decrease for all the samples, showing that activation of these samples is not required. As the value of x increases, cycling performance becomes better and Mg-5TaF5-5VCl3 exhibits even slight increases in the values of Ha for 5 min and 60 min, as the number of cycles increases. Table 1 presents the variations in Ha for 5 min and 60 min at 593 K in 12 bar H2 with the number of cycles, n, for Mg-xTaF5-xVCl3 (x=1.25, 2.5, and 5).
Figure 6 shows the variations in Hd for 5 min and 60 min at 593 K in 1.0 bar H2 with the number of cycles, n, for Mg-xTaF5-xVCl3 (x=1.25, 2.5, and 5). All of the three samples have very similar values of Hd for 5 min from n=1 to n=4 and the values of Hd for 5 min remain quite constant from n=1 to n=4. In n=1-4, Mg-1.25TaF5-1.25VCl3 has the largest value in Hd for 60 min. In n=1, Mg-1.25TaF5-1.25VCl3 releases 0.50 wt% H for 5 min and 3.81 wt% H for 60 min at 593 K in 1.0 bar H2. Mg-2.5TaF5-2.5VCl3 has the best cycling performance in Hd for 60 min, followed in order by Mg-5TaF5-5VCl3 and Mg-1.25TaF5-1.25VCl3. Table 2 presents the variations in Hd for 5 min and 60 min at 593 K in 1.0 bar H2 with the number of cycles for Mg-xTaF5-xVCl3 (x=1.25, 2.5, and 5).
The XRD pattern of Mg-2.5TaF5-2.5VCl3 dehydrided in the 6th hydrogen uptake-release cycle showed that this sample contained Mg, β-MgH2, and very small amounts of MgF2, V, Ta2H, and MgO. The formation of MgF2 was reported in the MgH2-7 wt% NbF5 [19], MgH2-7 wt% TaF5 [19], MgH2-4 wt% TiF3 [24], and MgH2-4 wt% TiCl3 [24], after hydrogen uptake-release cycling. The lower background of the XRD pattern, compared with that of the XRD pattern for the as-milled samples, suggested that the sample had better crystallinity. The γ-MgH2 contained in the as-milled samples disappeared. V remained after the hydrogen release reaction. MgO was believed to have been formed by the reaction of Mg with oxygen contained as an impurity in the hydrogen.
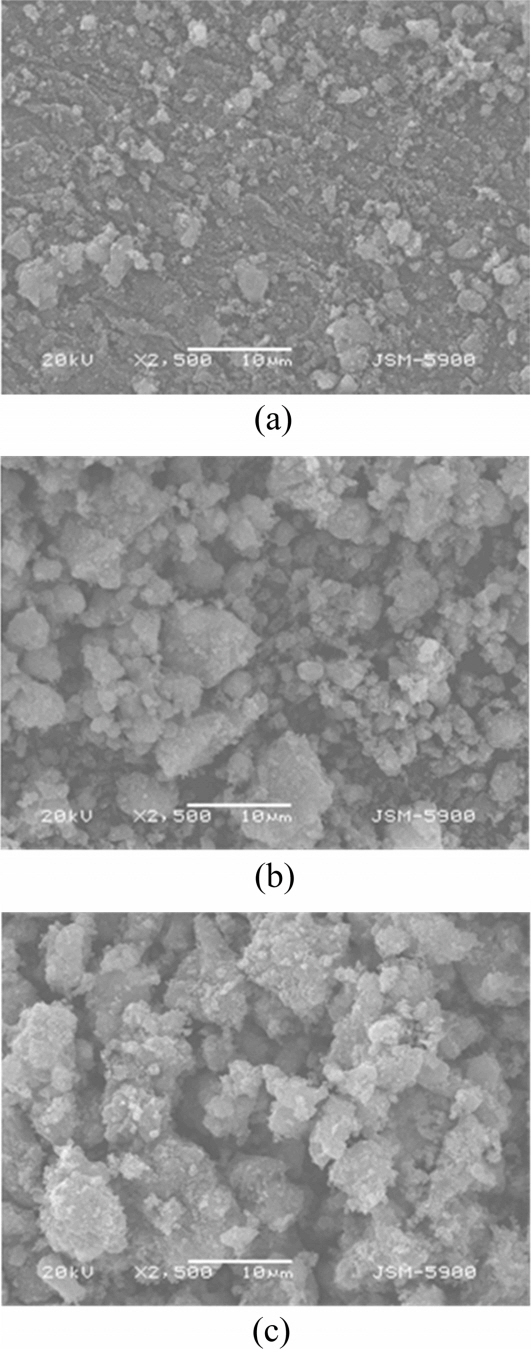
Figure 7 shows SEM micrographs of Mg-xTaF5-xVCl3 (x=1.25, 2.5, and 5) dehydrided in the 6th hydrogen uptake-release cycle. Mg-1.25TaF5-1.25VCl3 has the smallest particles, followed in order by Mg-2.5TaF5-2.5VCl3 and Mg-5TaF5-5VCl3, whose particles are much larger than those of Mg-1.25TaF5-1.25VCl3. The particles of Mg-2.5TaF5-2.5VCl3 are slightly smaller than those of Mg-5TaF5-5VCl3. The particle sizes are not homogeneous. After hydrogen uptake-release cycling, the particles of Mg-1.25TaF5-1.25VCl3 and Mg-5TaF5-5VCl3 became smaller, while the particles of Mg-2.5TaF5-2.5VCl3 became larger, compared with those of the as-milled samples. The hydrogen uptake-release cycling, involving expansion and contraction of the materials, is also believed to form imperfections, make new clean surfaces, and decrease the particle size of Mg [25-33], while maintaining relatively high temperatures during the hydrogen uptake-release cycling is considered to make the particles coalesce. Even though Mg-1.25TaF5-1.25VCl3 and Mg-5TaF5-5VCl3 were cycled at similar temperatures, the particle sizes of these samples decreased. In the Mg-1.25TaF5-1.25VCl3 and Mg-5TaF5-5VCl3 samples, it is believed that the degree of particle size reduction due to expansion and contraction with cycling is larger than the degree of particle size increase due to coalescence from maintaining the relatively high temperature. Finer particles are believed to have higher probability of coalescence than coarse particles due to difference in the contact conditions of the particles.
The MgF2, V, Ta2H, and MgO phases contained in the samples after hydrogen uptake-release cycling are believed to prevent the particles from coalescing to some degree during hydrogen uptake-release cycling by staying among the particles. The effects of hydrogen uptake-release cycling are the greatest in the Mg-1.25TaF5-1.25VCl3 sample.
The Ha versus t curves in 12 bar H2 and Hd versus t curves in 1.0 bar H2 at 593 K in n=4 for Mg-xTaF5-xVCl3 (x=1.25, 2.5, and 5) are shown in Fig. 8. Mg-2.5TaF5-2.5VCl3 has the highest initial hydrogen uptake rate and the largest amount of hydrogen absorbed for 60 min, followed in order by Mg-5TaF5-5VCl3 and Mg-1.25TaF5-1.25VCl3. Mg-5TaF5-5VCl3 has the highest initial hydrogen release rate, followed in order by Mg-2.5TaF5-2.5VCl3 and Mg-1.25TaF5-1.25VCl3. Mg-1.25TaF5-1.25VCl3 has the largest amount of hydrogen released for 60 min, followed in order by Mg-2.5TaF5-2.5VCl3 and Mg-5TaF5-5VCl3. Table 3 presents the variations in Ha with time and the hydrogen uptake rate for 5 min at 593 K in 12 bar H2 in n=4 for Mg-xTaF5-xVCl3. Table 4 presents the variations in Hd with time and the hydrogen release rate for 5 min at 593 K in 1.0 bar H2 in n=4 for Mg-xTaF5-xVCl3.
Figure 9 shows the Hd versus t curves at 623 K in 1.0 bar H2 in n=5 for Mg-xTaF5-xVCl3 (x=1.25, 2.5, and 5). In contrast to the very low initial hydrogen release rates of the samples at 593 K in n=1, the samples have quite high initial hydrogen release rates, showing that the nucleation of the Mg-H solid solution occur rapidly in the samples at 623 K in n=5. Mg-1.25TaF5-1.25VCl3 has the highest initial hydrogen release rate, followed in order by Mg-2.5TaF5-2.5VCl3 and Mg-5TaF5-5VCl3. Mg-1.25TaF5-1.25VCl3 has the largest amount of hydrogen released for 60 min, followed in order by Mg-2.5TaF5-2.5VCl3 and Mg-5TaF5-5VCl3. Mg-1.25TaF5-1.25VCl3 releases 2.01 wt% H for 5 min and 4.89 wt% H for 30 min in 1.0 bar H2. Figure 7 shows that after hydrogen uptake-release cycling, Mg-1.25TaF5-1.25VCl3 has the smallest particles, followed in order by Mg-2.5TaF5-2.5VCl3 and Mg-5TaF5-5VCl3, whose particles are much larger than those of Mg-1.25TaF5-1.25VCl3. The order of increasing particle size in the samples conforms well with the orders of decreasing initial hydrogen release rate and decreasing amount of hydrogen released for 60 min from the samples: the smaller the particle size, the higher the initial hydrogen release rate and the larger the amount of hydrogen released for 60 min. Table 5 gives the variations in Hd with time and the hydrogen release rate for 5 min at 623 K in 1.0 bar H2 in n=5 for Mg-xTaF5-xVCl3 (x=1.25, 2.5, and 5).
4. CONCLUSIONS
In the present work, samples with compositions of Mg-x wt% TaF5-x wt% VCl3 (x=1.25, 2.5, and 5) were prepared by reactive mechanical grinding. When the as-milled samples were heated at a heating rate of 5-6 K/min, Mg-2.5TaF5-2.5VCl3, with the smallest particle size, had the largest total released hydrogen amount (4.00 wt%), beginning to release hydrogen at 613 K. In the first cycle, Mg-2.5TaF5-2.5VCl3 had quite a high effective hydrogen storage capacity (the amount of hydrogen absorbed for 60 min) of 5.86 wt%. Activation of the samples was not required. Mg-2.5TaF5-2.5VCl3 after reactive mechanical grinding contained Mg, β-MgH2, and very small amounts of γ-MgH2, V, and TaF5. Mg-2.5TaF5-2.5VCl3 dehydrided in the 6th hydrogen uptake-release cycle contained Mg, β-MgH2, and very small amounts of MgF2, V, and Ta2H. Among the three samples, Mg-1.25TaF5-1.25VCl3 had the best hydrogen release properties. In n=4, Mg-1.25TaF5-1.25VCl3 had the largest Hd for 60 min at 593 K in 1.0 bar H2, releasing 0.23 wt% H for 5 min, 0.34 wt% H for 10 min, and 3.31 wt% H for 60 min. After hydrogen uptake-release cycling, Mg-1.25TaF5-1.25VCl3 had the smallest particle size. In n=5, Mg-1.25TaF5-1.25VCl3 released 2.01 wt% H for 5 min, 3.78 wt% H for 10 min, and 4.89 wt% H for 60 min at 623 K in 1.0 bar H2.