


1. INTRODUCTION
The highly estimated potential of magnesium hydride as a reversible hydrogen absorption and release medium has attracted many researchers’ attention [1-4]. Magnesium (Mg) has a large hydrogen-absorbing capacity (about 7.6 wt%) and is of relatively low price. However, it is known that the hydrogenation of Mg halts after the formation of a small quantity of hydride and the hydrogenation rate decreases very sharply. Much research has been conducted on increasing the hydrogenation and dehydrogenation rates of magnesium [5-9] by adding metals to magnesium or magnesium hydride [10,11], by preparing Mg-containing compounds such as Mg51Zn20 [12] and Mg2FeH6 [13] and Mg2CoH5[13], and by using various processing like cold forging [14] and filing [15].
Among the studies in which carbon materials have been added, Jang et al. [16] synthesized MgHx by milling in hydrogen for 96 h and prepared MgHx-graphene composites by adding 5 or 10 wt% graphene to MgHx via milling for 72 h in a planetary ball mill in argon. They reported that at 423 K, the added graphene was found to play the role of a hydrogen absorbent as well as a catalyst. Huot et al. [17] investigated the activation characteristics of graphite modified pure Mg, Mg2Ni, Ti, V, and FeTi by adding 10 wt% of graphite and milling the mixture during 30 min. The activation characteristics of the graphite-containing materials were dramatically improved. The authors proposed that graphite prevents a new oxide layer of the surface of the materials from being formed once the native oxide layer is broken during milling for sample preparation. Spassov et al. [18] synthesized 75 at% MgH2 + 25 at% C composites by melding different carbons, such as carbon black, nanodiamonds, and amorphous carbon soot, to MgH2 in a ball mill. They insisted that the inclusion of the different carbons made a difference in the hydrogenation and dehydrogenation features of the Mg–C composites and that the added carbons are supposed to catalyze the hydrogenation and dehydrogenation of the composites as well as protect magnesium from oxidation. Among the composites, Mg–carbon black revealed the best hydrogenation properties – low hydrogenation temperature and relatively rapid hydrogenation kinetics.
In our previous work, graphene was added to increase the hydrogenation and dehydrogenation rates of Mg. The hydrogenation rates of Mg were increased by adding graphene, but the dehydrogenation rates of graphene-added Mg were very low at 573 K and 593 K [19,20]. It is reported that Ni addition increases the hydrogenation and dehydrogenation rates of Mg [21-24].
In this work, Ni was used as an additive to increase the dehydrogenation rates of graphene-added Mg. The sum of all the additives was 5 wt%. Samples with a composition of 95 wt% Mg + 2.5 wt% Ni + 2.5 wt% graphene were prepared by ball milling in hydrogen (reactive ball milling). The samples were designated as Mg-2.5Ni-2.5graphene. The hydrogenation and dehydrogenation features of the synthesized specimens were investigated and compared with those of 95 wt% Mg + 5 wt% graphene (named Mg-5graphene) reported in our previous work [11].
2. MATERIALS AND METHODS
The beginning materials were pure Mg powder (-20 +100 mesh, purity 99.8%, Alfa Aesar), Ni (Nickel powder APS, 2.2 – 3.0 μm, purity 99.9 %, C typically < 0.1%, Alfa Aesar), and graphene (3-10 multi-layer graphene, length 5-10 μm, purity ≥99 wt%, thickness 3-6 nm, specific surface area 150 m2/g, producing method chemical exfoliation proprietary method, Carbon Nano-material Technology Co., Ltd).
Reactive ball milling was done in a planetary ball mill (Planetary Mono Mill; Pulverisette 6, Fritsch) for 12 h. A mixture of Mg (7.6 g) and Ni (0.2 g) was melded with 105 hardened steel balls (total weight = 360 g) with a disc revolution speed of 400 rpm in hydrogen of about 12 bar, which was replenished every two hours [25,26].
To prepare Mg-2.5Ni-2.5graphene, the inclusion of graphene (0.2 g) to the pre-milled mixture of Mg (7.6 g) and Ni (0.2 g) was also carried out for 30 min under conditions similar to those for the preparation of the pre-milled mixture of Mg (7.6 g) and Ni (0.2 g).
The variation of absorbed or released hydrogen amount was measured with time in a Sievert’s type hydrogenation and dehydrogenation apparatus explained previously [26]. During the measurements, the hydrogen pressures in the specimen container were kept nearly constant by replenishing the absorbed hydrogen from a standard volume reservoir (a small reservoir of a known volume) during hydrogenation and by taking the released hydrogen away to the standard volume reservoir during dehydrogenation. 0.5 g of the specimens was used for the measurement of the variation with time of the absorbed or released hydrogen amount. After we measured the absorbed hydrogen amount in 12 bar H2 for 1 h and then the released hydrogen amount in 1.0 bar H2 for 1 h, the sample was dehydrogenated at 623 K in a vacuum for 1.5 h to fully dehydrogenate the sample.
The phases formed in the specimens after reactive ball milling or after hydrogenation-dehydrogenation cycling were analyzed from X-ray diffraction (XRD) patterns obtained with Cu Kα radiation in a powder diffractometer (Rigaku D/MAX 2500). To observe the microstructures of the specimens after reactive ball milling or after hydrogenation-dehydrogenation cycling, a scanning electron microscope (SEM) (JSM-5900) operated at 15 kV and a high-resolution transmission electron microscope (HR-TEM) (JEM-2010) operated at 200 kV were used.
3. RESULTS AND DISCUSSION
The amount of hydrogen absorbed by the sample, Ha, was calculated using the sample weight as a standard. The amount of hydrogen released by the sample, Hd, was also calculated using the sample weight as a standard. Ha and Hd were given in the unit of wt% H.
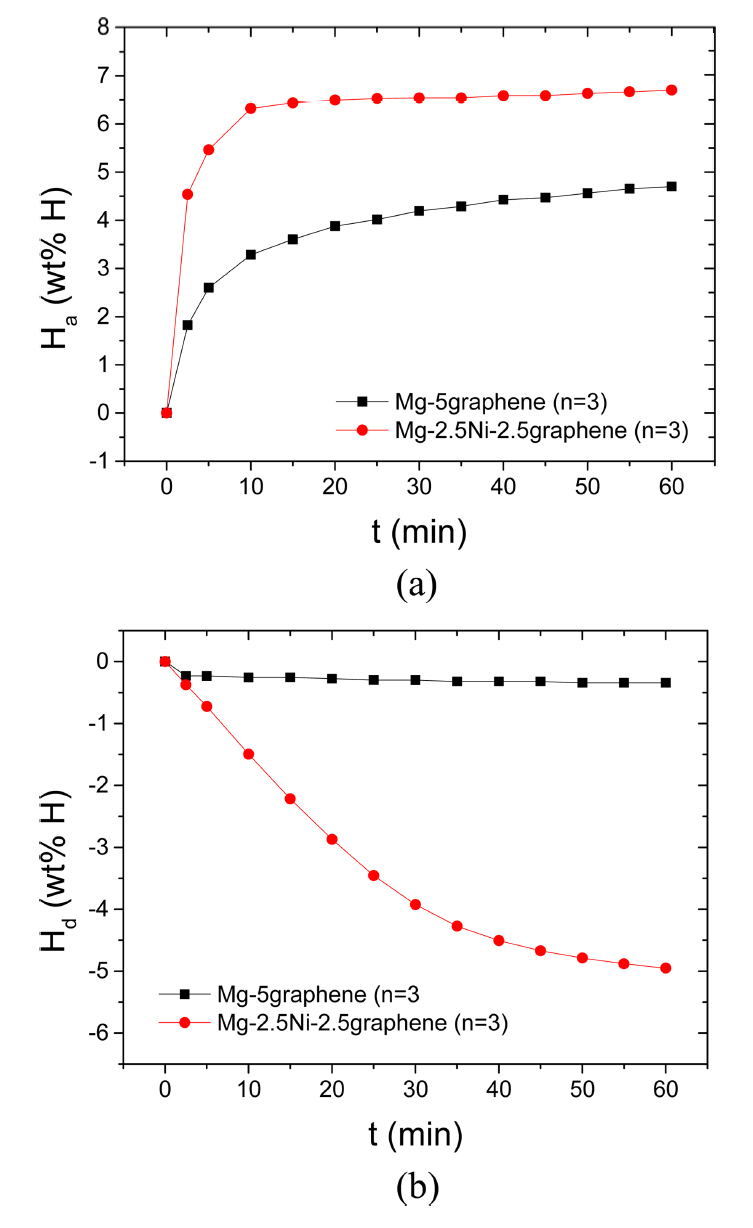
Figure 1 shows the curves of Ha as a function of time t in 12 bar H2 and the curves of Hd as a function of time t in 1.0 bar H2 at 573 K at the third hydrogenation-dehydrogenation cycle (n=3) for Mg-5graphene and Mg-2.5Ni-2.5graphene. The initial hydrogenation rate of Mg-5graphene is relatively high, and the hydrogenation rate of Mg-5graphene decreases as the time elapses. The initial hydrogenation rate of Mg-2.5Ni-2.5graphene is very high, and the hydrogenation rate of Mg-2.5Ni-2.5graphene decreases as the hydrogenation progresses. Mg-2.5Ni-2.5graphene has a much higher initial hydrogenation rate and a significantly greater amount of hydrogen taken after 60 min, Ha (60 min), than Mg-5graphene. The quantities of hydrogen absorbed by Mg-2.5Ni-2.5graphene are 4.54 wt% H after 2.5 min, 6.32 wt% H after 10 min, and 6.70 wt% H after 60 min. The quantities of hydrogen absorbed by Mg-5graphene are 1.82, 3.28, and 4.70 wt% H after 2.5, 10, and 60 min, respectively. The initial dehydrogenation rate of Mg-5graphene is very low, and the dehydrogenation rate of Mg-5graphene is also low after 2.5 min. The initial dehydrogenation rate of Mg-2.5Ni-2.5graphene is relatively high, and the dehydrogenation rate of Mg-2.5Ni-2.5graphene decreases as the dehydrogenation progresses. Mg-2.5Ni-2.5graphene has a higher initial dehydrogenation rate and a significantly greater amount of hydrogen released for 60 min, Hd (60 min), than Mg-5graphene. The quantities of hydrogen released by Mg-2.5Ni-2.5graphene are 0.37 wt% H after 2.5 min, 1.50 wt% H after 10 min, and 4.95 wt% H after 60 min. The quantities of hydrogen released by Mg-5graphene are 0.23, 0.25, and 0.34 wt% H after 2.5, 10, and 60 min, respectively.
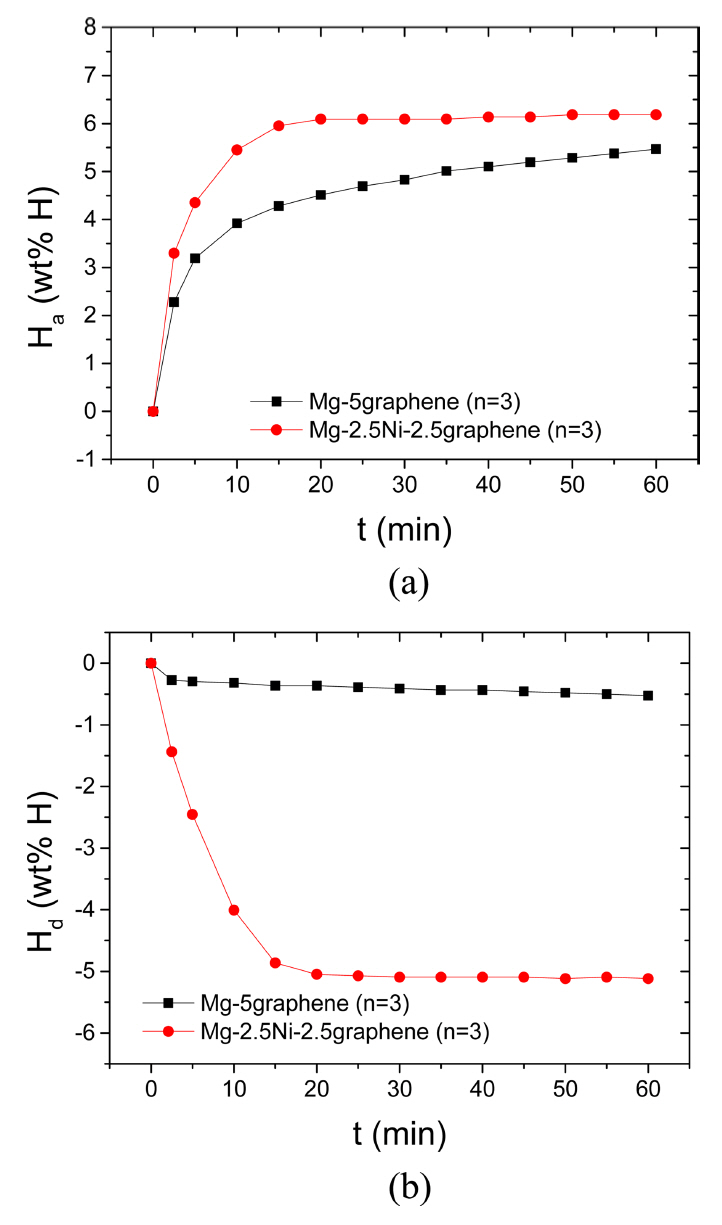
The curves of Ha as a function of t in 12 bar H2 and the curves of Hd as a function of t in 1.0 bar H2 at 593 K at n=3 for Mg-5graphene and Mg-2.5Ni-2.5graphene are shown in Fig 2. The initial hydrogenation rate of Mg-5graphene is relatively high, and the hydrogenation rate of Mg-5graphene decreases as the time elapses. The initial hydrogenation rate of Mg-2.5Ni-2.5graphene is very high, and the hydrogenation rate of Mg-2.5Ni-2.5graphene decreases as the hydrogenation progresses. Mg-2.5Ni-2.5graphene has a fairly higher initial hydrogenation rate and a fairly larger Ha (60 min) than Mg-5graphene. The quantities of hydrogen absorbed by Mg-2.5Ni-2.5graphene are 3.30 wt% H after 2.5 min, 5.45 wt% H after 10 min, and 6.18 wt% H after 60 min. The quantities of hydrogen absorbed by Mg-5graphene are 2.28 wt% H after 2.5 min, 3.92 wt% H after 10 min, and 5.47 wt% H after 60 min. The initial dehydrogenation rate of Mg-5graphene is very low, and the dehydrogenation rate of Mg-5graphene is also low after 2.5 min. The initial dehydrogenation rate of Mg-2.5Ni-2.5graphene is very high, and the dehydrogenation rate of Mg-2.5Ni-2.5graphene decreases as the dehydrogenation progresses. Mg-2.5Ni-2.5graphene has a significantly higher initial dehydrogenation rate and a significantly greater Hd (60 min) than Mg-5graphene. The quantities of hydrogen released by Mg-2.5Ni-2.5graphene are 1.44 wt% H after 2.5 min, 4.01 wt% H after 10 min, and 5.12 wt% H after 60 min. The quantities of hydrogen released by Mg-5graphene are 0.27, 0.32, and 0.53 wt% H after 2.5, 10, and 60 min, respectively.
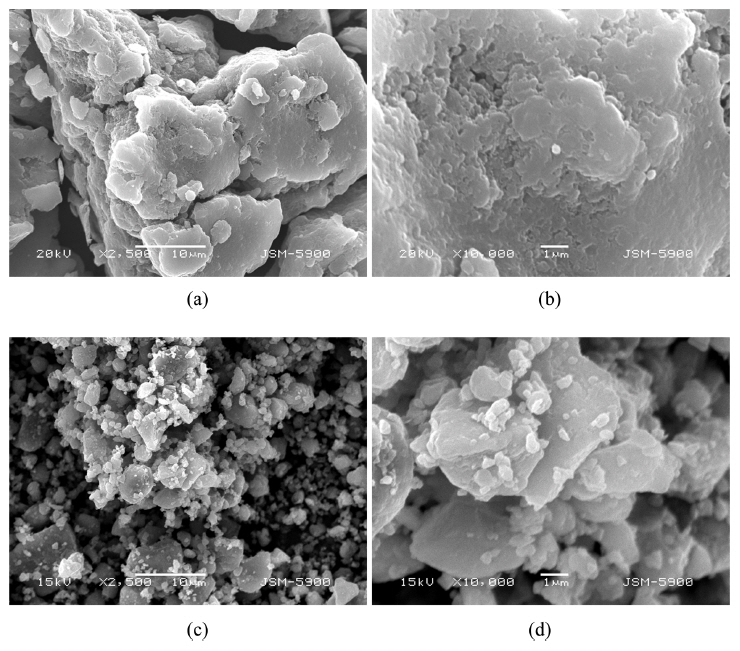
Figure 3 shows the SEM micrographs at different magnifications of Mg-5graphene and Mg-2.5Ni-2.5graphene after reactive ball milling. Mg-5graphene after reactive ball milling has no homogeneous particle size. Some parts of the particle surfaces are flat and other parts are undulated. The particle size of Mg-2.5Ni-2.5graphene after reactive ball milling is not homogeneous. The surfaces of the particles are smooth, and small particles are on large particles. The particles of Mg-2.5Ni-2.5graphene after reactive ball milling are much smaller than those of Mg-5graphene after reactive ball milling.
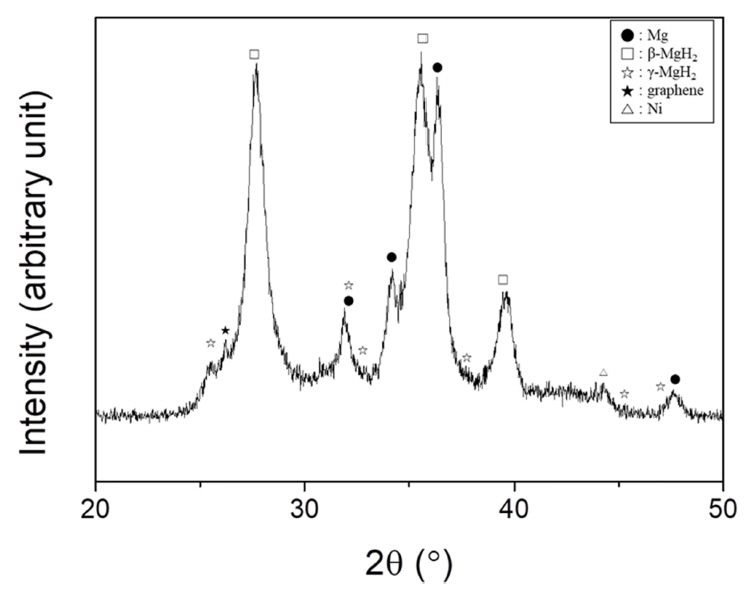
The XRD pattern of Mg-2.5Ni-2.5graphene after reactive ball milling is exhibited in Fig 4. The sample contains β-MgH2 (JCPDS Card No.12-0697) and Mg (35-0821), and small amounts of γ-MgH2 (35-1184), graphene (75-1621), and Ni (04-0850). Reactive ball milling is believed to have induced microstrain and reduced the particle size, leading to the formation of broad peaks (strain broadening and particlesize broadening, respectively). The formation of broad peaks is deemed to heighten the background of the XRD pattern. The crystallite size of Mg was calculated as 13 nm using the Scherrer formula.
Figure 5 shows the curves of the released hydrogen quantity Hd as a function of temperature for Mg-5graphene and Mg-2.5Ni-2.5graphene when the as-prepared sample was heated at a rate of 5~6 K/min. Mg-5graphene begins to release hydrogen at 683 K. The temperature increases up to 695 K and decreases to 688 K. The decrease in temperature from 695 K to 688 K is believed to result from the higher decrease rate in temperature due to hydrogen release than the increase rate in temperature due to heating. The total released hydrogen quantity is 1.07 wt%. Mg-2.5Ni-2.5graphene begins to release hydrogen at 581 K and releases it very slowly from 668 K to 692 K. The total released hydrogen quantity is 3.48 wt%. The addition of Ni lowers the temperature at which the sample begins to release hydrogen (the magnesium hydride decomposition temperature) from 683 K to 581 K and increases the total amount of released hydrogen.
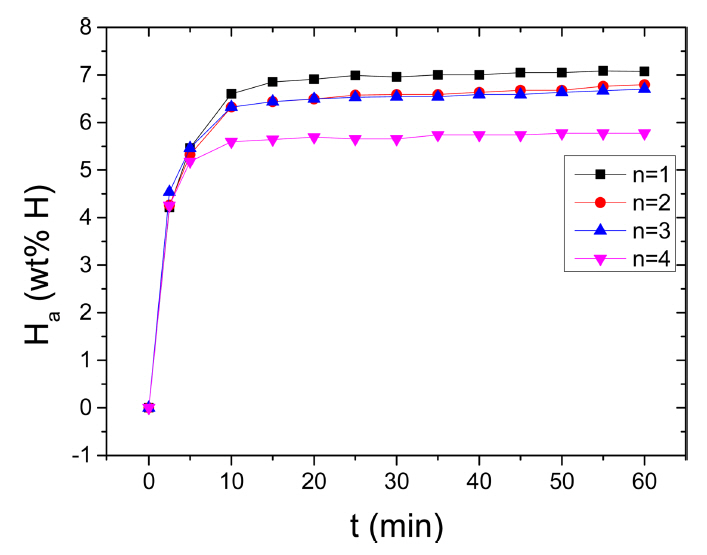
The variation in the curve of Ha as a function of t at 573 K in 12 bar H2 with the number of hydrogenation-dehydrogenation cycles, n, for Mg-2.5Ni-2.5graphene is shown in Fig 6. From n=1, the initial hydrogenation rate of Mg-2.5Ni-2.5graphene is very high and the Ha (60 min) of Mg-2.5Ni-2.5graphene is large. From n=1 to n=2, the initial hydrogenation rate increases very slightly, and the Ha (60 min) decreases slightly. At n=2, n=3, and n=4, the initial hydrogenation rates are similar, but the Ha (60 min) at n=4 is smaller than those at n=1 and n=2. At n=1, the quantities of hydrogen absorbed by Mg-2.5Ni-2.5graphene are 4.21 wt% H after 2.5min, 6.60 wt% H after 10 min, and 7.07 wt% H after 60 min. At n=4, the quantities of hydrogen absorbed by Mg-2.5Ni-2.5graphene are 4.25, 5.60, and 5.77 wt% H after 2.5, 10, and 60 min, respectively.
We defined an efficient capacity of stored hydrogen as the quantity of hydrogen absorbed for 60 min. Mg-2.5Ni-2.5graphene had a very high efficient capacity of stored hydrogen higher than 7 wt% (7.07 wt% at 573 K in 12 bar H2 at n=1).
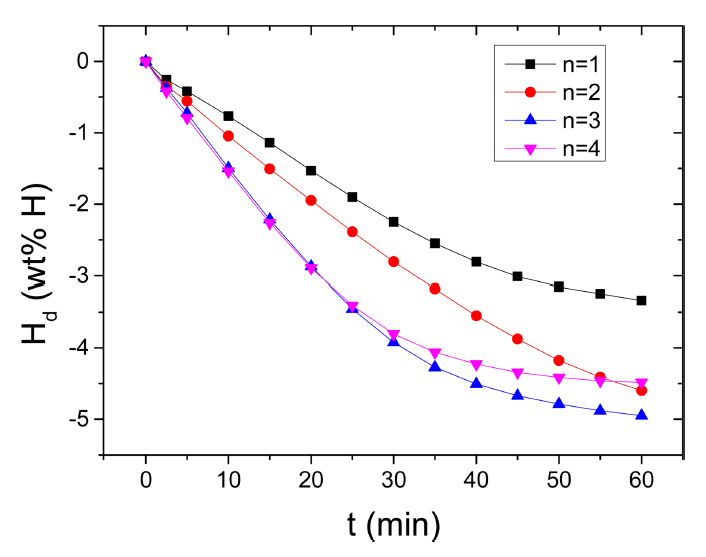
Figure 7 shows the variation in the curve of Hd as a function of t at 573K in 1.0 bar H2 with the number of hydrogenation-dehydrogenation cycles, n, for Mg-2.5Ni-2.5graphene. From n=1, the initial dehydrogenation rate of Mg-2.5Ni-2.5graphene is high, and the Hd (60 min) of Mg-2.5Ni-2.5graphene is quite large. From n=1 to n=4, the initial dehydrogenation rate increases. The Hd (60 min) increases from n=1 to n=3 but decreases as n increases from three to four. At the first cycle, the quantities of hydrogen released by Mg-2.5Ni-2.5graphene are 0.26 wt% H after 2.5min, 0.77 wt% H after 10 min, and 3.34 wt% H after 60 min. At n=3, the quantities of hydrogen released by Mg-2.5Ni-2.5graphene are 0.37, 1.50, and 4.95 wt% H after 2.5, 10, and 60 min, respectively.
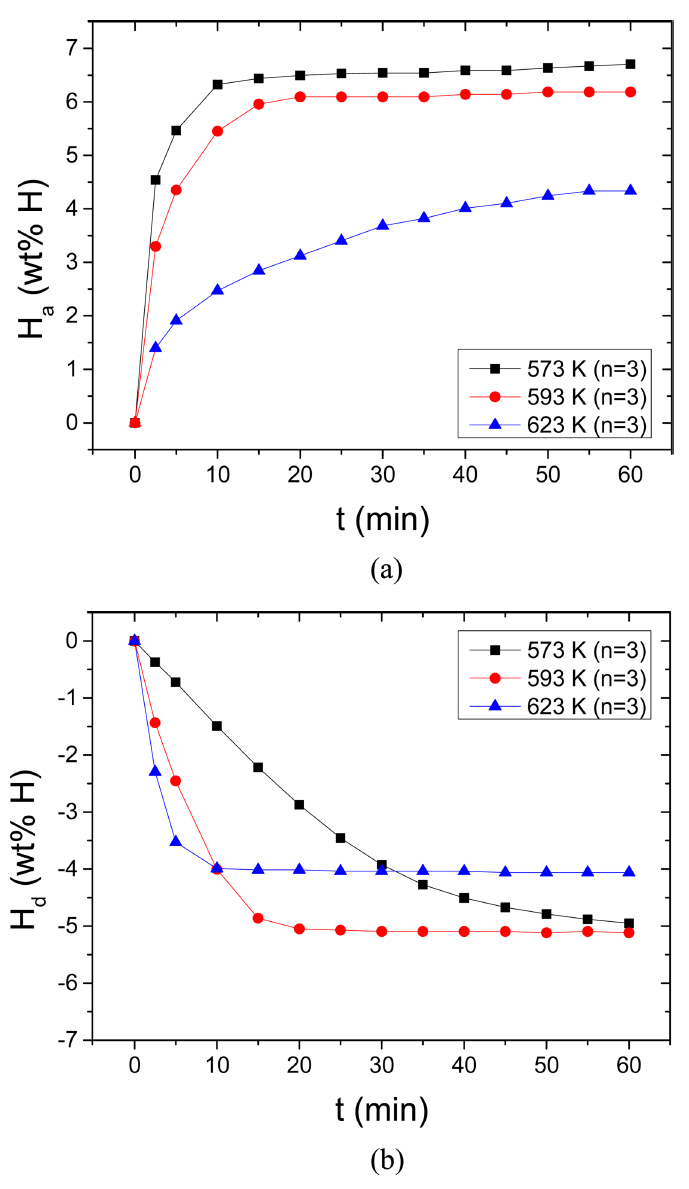
The variations in the curve of Ha as a function of t in 12 bar H2 and the curve of Hd as a function of t in 1.0 bar H2 with temperature (523 K, 573 K, and 623 K) at n=3 for Mg-2.5Ni-2.5graphene are given in Fig 8. With the increase in the temperature from 573 K to 593 K, the initial hydrogenation rate and the Ha (60 min) decrease slightly. The increase in the temperature from 593 K to 623 K significantly decreases the initial hydrogenation rate and the Ha (60 min). At 573 K, the quantities of hydrogen absorbed by Mg-2.5Ni-2.5graphene are 4.54 wt% H after 2.5 min, 6.32 wt% H after 10 min, and 6.70 wt% H after 60 min. At 623 K, the quantities of hydrogen absorbed by Mg-2.5Ni-2.5graphene are 1.40, 2.47, and 4.33 wt% H after 2.5, 10, and 60 min, respectively. The driving force for hydrogenation is related to the gap between the pressure for hydrogenation (12 bar H2 in the present work) and the equilibrium plateau hydrogen pressure at a hydrogenation temperature. The equilibrium hydrogen pressures at the plateaus of the pressure-composition isotherms for Mg-H2 system are 1.55 bar, 2.69 bar, and 7.28 bar at 573 K, 593 K, and 623 K, respectively, [28]. The driving forces for hydrogenation of Mg are thus 10.45 bar, 9.31 bar, and 4.72 bar, respectively, at 573 K, 593 K and 623 K. Decrease in the driving forces for hydrogenation of Mg with the increase in temperature is thus believed to decrease the initial hydrogenation rate and the Ha (60 min), even though the effect of temperature increase is believed to increase them. A small decrease in the driving force from 573 K to 593 K and a large decrease in the driving force from 593 K to 623 K are directly proportional to the decreases in the initial hydrogenation rate and the Ha (60 min) from 573 K to 593 K and from 593 K to 623 K. Table 1 shows the variations in Ha (wt% H) with t at 573 K, 593 K, and 623 K in 12 bar H2 at the third cycle for Mg-2.5Ni-2.5graphene.
The increase in temperature from 573 K to 593 K increases greatly the initial dehydrogenation rate. From 593 K to 623 K, the initial dehydrogenation rate increases fairly. The Hd (60 min) increases slightly from 573 K to 593 K and decreases significantly from 593 K to 623 K. The Hd (60 min) at 623 K is relatively small since a small amount of hydrogen has been absorbed before the dehydrogenation measurement (the Ha (60 min) at 623 K is small). At 593 K, the quantities of hydrogen released by Mg-2.5Ni-2.5graphene are 1.44 wt% H after 2.5 min, 4.01 wt% H after 10 min, and 5.12 wt% H after 60 min. At 623 K, the quantities of hydrogen released by Mg-2.5Ni-2.5graphene are 2.30, 4.00, and 4.06 wt% H after 2.5, 10, and 60 min, respectively. The driving force for dehydrogenation is related to the gap between the equilibrium plateau hydrogen pressure at a dehydrogenation temperature and the pressure for dehydrogenation (1.0 bar H2 in the present work). The equilibrium hydrogen pressures at the plateaus of the pressure-composition isotherms for Mg-H2 system are 1.55 bar, 2.69 bar, and 7.28 bar at 573 K, 593 K, and 623 K, respectively, [28]. The driving forces for dehydrogenation of MgH2 are thus 0.55 bar, 1.69 bar, and 6.28 bar at 573 K, 593 K, and 623 K, respectively. Increase in the driving forces for dehydrogenation of MgH2 with the increase in temperature, together with the effect of temperature increase, is thus believed to increase the initial dehydrogenation rate. Table 2 shows the variations in Hd (wt% H) with t at 573 K, 593 K, and 623 K in 1.0 bar H2 at the third cycle for Mg-2.5Ni-2.5graphene.
Figure 9 shows the SEM micrographs at different magnifications of Mg-2.5Ni-2.5graphene after hydrogenation-dehydrogenation cycling (n=4). The particle size of Mg-2.5Ni-2.5graphene after n=4 is not homogeneous; some particles are large and some particles are small. Some large particles are covered with small particles. The small particles of Mg-2.5Ni-2.5graphene after n=4 is much more numerous than those of Mg-2.5Ni-2.5graphene after reactive ball milling. Expansion and contraction of the particles with hydrogenation-dehydrogenation cycling is believed to have increased the number of small particles.
The XRD pattern of Mg-2.5Ni-2.5graphene after hydrogenation-dehydrogenation cycling (n=4) showed that the sample consisted of Mg together with small quantities of β-MgH2 (JCPDS Card No.12-0697), MgO (71-1176), Mg2Ni (43-0988), and graphene (75-1621). The γ-MgH2 phase, which was formed during the reactive ball milling, disappeared. Mechanical energy, which has been stored from mechanical grinding during reactive ball milling, is believed to have been used for the formation of the Mg2Ni phase from the reaction of Mg and Ni during hydrogenation-dehydrogenation cycling. The peaks were narrow and sharp, indicating that the microstrain accumulated during reactive ball milling had been relaxed. The crystallite size of Mg was calculated using the Scherrer formula as 29 nm, which was about 2.2 times the crystallite size of Mg after reactive ball milling (13 nm). The increase in the crystallite size of Mg after hydrogenation-dehydrogenation cycling suggests that the hydrogenation-dehydrogenation cycling decreases the grain boundary. It is reported that, since the structure of grain boundary is relatively more open than the atomic structure inside grains, the barrier for diffusion through the grain boundary is much less than that through the lattice, and the diffusion rate through grain boundary is higher [29]. The decrease in the grain boundary with hydrogenation-dehydrogenation cycling is believed to have contributed in part to the decrease in the hydrogenation and dehydrogenation rates as the number of cycles increases.
Figure 10 shows a micrograph obtained by high-resolution transmission electron microscope (HR-TEM) of Mg-2.5Ni-2.5graphene after hydrogenation-dehydrogenation cycling (n=4). The bottom part of the micrograph is the sample holder. The sample consists of very fine particles.
It is reported that the graphene added to MgHx or Mg-Li alloy acts as a catalyst [16,30]. Jang et al. [16], who prepared MgHx-graphene composites by adding 5 or 10 wt% graphene to MgHx (synthesized by milling in hydrogen) via milling for 72 h in a planetary ball mill in argon, reported that at 423 K, the added graphene was found to play the role of a hydrogen absorbent as well as a catalyst. Huanjian et al. [30] studied the effects of graphene inclusion on the hydrogenation and dehydrogenation features of Mg-Li alloy. They reported that the addition of graphene could prevent the particles from being agglomerated and make the particles more uniformly distributed in the course of milling. They insisted that graphene acted as a catalyst and thus lowered the apparent activation energy of dehydrogenation for the Mg-Li alloy, which consequently improved the reversibility of the hydrogen absorption and release of the alloy.
Milling mixtures in hydrogen is believed to create imperfections and induce microstrain (resulting in the ease of nucleation), produce fissures and fresh surfaces (resulting in increase in reactivity of the particles with hydrogen), and decrease particle sizes (resulting in decrease in the diffusion distances of hydrogen atoms) [31-37]. Figure 3 shows that the particles of Mg-2.5Ni-2.5graphene after reactive ball milling are much smaller than those of Mg-5graphene after reactive ball milling. The peaks in the XRD pattern of Mg-2.5Ni-2.5graphene after reactive ball milling are broader than those in the XRD pattern of Mg-5graphene after reactive ball milling and the XRD pattern of Mg-2.5Ni-2.5graphene after reactive ball milling exhibits the XRD pattern of somewhat amorphous material. The strongest peak of Mg in the XRD pattern of Mg-2.5Ni-2.5graphene after reactive ball milling has wider full width at half maximum (0.37 º) than that of the strongest peak of Mg in the XRD pattern of Mg-5graphene after reactive ball milling (0.28 º) [19]. Milling in hydrogen of a Ni-added Mg mixture (95Mg+2.5Ni) is believed to create more defects and induce greater microstrain, produce more cracks and clean surfaces, and decrease the particle size more greatly than milling in hydrogen of pure Mg.
Because graphene has a small average specific gravity, graphene has a large specific surface area. Consequently, although a small amount of graphene is included, the added graphene is extensively distributed in the specimen or on the particle surfaces. Since the thermal conductivity of graphene is high, the included graphene is thought to be able to disperse heat rapidly, which is released from the sample during hydrogenation and taken by the specimen from the specimen container during dehydrogenation. The addition of the graphene to the milled 95Mg+2.5Ni mixture is believed to help the sample have higher hydrogenation and dehydrogenation rates by separating particles via dispersion of graphene (leading to the prevention of agglomeration of particles during hydrogenation-dehydrogenation cycling at relatively high temperatures) and by dispersing heat rapidly thanks to high thermal conductivity.
Stronger milling effects on Mg (creation of defects and induction of microstrain, production of cracks and clean surfaces, and reduction of the particle size) by the addition of Ni are believed to have made Mg-2.5Ni-2.5graphene have a lower magnesium hydride decomposition temperature. Stronger milling effects on Mg by the addition of Ni and the Mg2Ni phase formed after cycling in the sample are believed to have made Mg-2.5Ni-2.5graphene have much higher initial hydrogenation and dehydrogenation rates, and significantly larger Ha (60 min) and Hd (60 min) than Mg-5graphene.
Hjort et al. [38] reported that mechanical treatment and/or alloying with additives create active nucleation sites and defects, facilitating nucleation. According to the report of Zaluska et al. [39], melding Mg with additives can decrease the magnesium particle size and thus reduce the diffusion distance of hydrogen atoms, and the additives, which produce microscopic passages of hydrogen, can increase hydrogen mobility. Vigeholm et al. [40] reported that an uneven surface of magnesium with many fissures and imperfections is considered more favorable for hydrogenation.
The XRD pattern of Mg-2.5Ni-2.5graphene after dehydrogenation-dehydrogenation cycling (n=4) revealed the presence of Mg2Ni phase in the sample. The Mg2Ni phase is known to have higher hydrogenation and dehydrogenation rates than the Mg phase. Stronger milling effects of Mg by the addition of Ni and the Mg2Ni phase formed in the sample are believed to have made Mg-2.5Ni-2.5graphene have lower magnesium hydride decomposition temperature, much higher initial hydrogenation and dehydrogenation rates, a significantly higher efficient capacity of stored hydrogen [Ha (60 min)], and a much larger Hd (60 min) than Mg-5graphene.
The addition of Ni brings about the stronger milling effects of Mg and the formation of Mg2Ni phase. The addition of the graphene to the milled 95Mg+2.5Ni mixture separates particles via dispersion of graphene (leading to the prevention of agglomeration of particles during cycling at relatively high temperatures) and disperses heat rapidly thanks to high thermal conductivity. These are the synergetic effects of Ni and graphene addition to Mg. It is known that Ni has no strong interaction with carbon, differently from other transition elements. This thus brings about no other synergetic effects of the simultaneous Ni and graphene addition to Mg. Therefore, the effects explained above (the stronger milling effects of Mg, the formation of Mg2Ni phase, separation of particles, and dispersing heat rapidly) are believed the main effects of the simultaneous addition of Ni and graphene. It is still controversial as to whether the hexagonal phase is Ni carbide or metallic Ni in many investigations on the synthesis of Ni nanoparticles because the X-ray diffraction pattern in the International Center for Diffraction Data (ICDD) database of the former is very similar to that of the latter [41]. Fujieda et al. [41] insisted that nanoparticles of Ni carbide of about 50 nm in diameter with Ni3C-type structure were synthesized by the reduction of Ni salt in a polyol solution in the presence of polyvinylpyrrolidone (PVP). According to a report [42], Ni3C is predicted to be nonmagnetic in the ordered phase. Yue et al. [42] prepared the metastable Ni3C phase by mechanically alloying Ni and C for 90 h. The synthesized Ni3C had the particle diameter of 10 nm and was disordered and ferromagnetic. We could not find the Ni3C phase in the Mg-2.5Ni-2.5graphene samples after reactive ball milling and after hydrogenation-dehydrogenation cycling.
4. CONCLUSIONS
Ni was used as an additive to increase the dehydrogenation rates of graphene-added Mg. Samples (designated as Mg-2.5Ni-2.5graphene) with a composition of 95 wt% Mg + 2.5 wt% Ni + 2.5 graphene were prepared by milling in hydrogen (reactive ball milling). Mg-2.5Ni-2.5graphene had significantly higher initial hydrogenation and dehydrogenation rates and much greater amounts of hydrogen absorbed and released after 60 min, Ha (60 min) and Hd (60 min), respectively, than Mg-5graphene, indicating that the addition of Ni to the Mg-5graphene increased the hydrogenation rate as well as the dehydrogenation rate. The addition of Ni lowered the magnesium hydride decomposition temperature from 683 K to 581 K. Mg-2.5Ni-2.5graphene had a very high efficient capacity of stored hydrogen (the amount of hydrogen absorbed in 60 min) higher than 7 wt% (7.07 wt% at 573 K in 12 bar H2 at n=1). The activation of Mg-2.5Ni-2.5graphene was finished after n=2. At the first cycle at 573K, the quantities of hydrogen released by Mg-2.5Ni-2.5graphene were 0.26 wt% H after 2.5 min, 0.77 wt% H after 10 min, and 3.34 wt% H after 60 min in 1.0 bar H2. Stronger milling effects on Mg (creation of defects and induction of microstrain, production of cracks and clean surfaces, and reduction of the particle size) by the addition of Ni are believed to have made Mg-2.5Ni-2.5graphene have a lower magnesium hydride decomposition temperature. Stronger milling effects on Mg by the addition of Ni and the Mg2Ni phase formed after cycling in the sample are believed to have made Mg-2.5Ni-2.5graphene have much higher initial hydrogenation and dehydrogenation rates, and significantly larger Ha (60 min) and Hd (60 min) than Mg-5graphene.