


1. INTRODUCTION
Ternary carbides such as Ti3AlC2 and Ti3SiC2 consist of edge-sharing Ti3C2 layers, which are separated by hexagonal nets of Al and Si atoms, respectively [1]. Like metals, they have good thermal and electrical conductivity, high toughness, and good machinability. Like ceramics, they display excellent chemical resistance, high YoungŌĆÖs moduli, high temperature strength, and high melting points. Ti3AlC2 and Ti3SiC2 form Ti3AlxSi1-xC2 solid solutions, which have attracted enormous interest for a number of applications because of their high strength, hardness, and good oxidation resistance [2-4]. To utilize Ti3AlxSi1-xC2 quaternary carbides as structural components, a comprehensive understanding of their oxidation properties over a wide range of temperatures is essential. Previously, Ti3AlxSi1-xC2 carbides with various compositions were synthesized via powder metallurgical routes, and their oxidation behavior was studied at 900-1300 ┬░C [3-10]. Zhou et al. reported that Ti3AlxSi1-xC2 (x=0.05-0.15, 0.75-0.95) displayed good oxidation resistance at 900-1100 ┬░C, because of formation of a continuous, protective ╬▒-Al2O3 layer, in addition to the less protective TiO2 [3-5]. The oxidation resistance of Ti3AlxSi1-xC2 decreased at 1200-1350 ┬░C owing to additional formation of Al2TiO5 through the reaction of ╬▒-Al2O3 and TiO2 [4]. Besides ╬▒-Al2O3 and TiO2, the formation of a small amount of protective SiO2 in oxide scales during oxidation at 900-1100 ┬░C was also reported by Liu et al [6]. Lee et al. reported that the oxidation of Ti3AlxSi1-xC2 at 900-1200 ┬░C led to formation of oxide scales that consisted of an outer (rutile-TiO2, ╬▒-Al2O3)-mixed layer, a thin, intermediate Al2O3 layer, and an inner (rutile-TiO2, amorphous SiO2)-mixed layer [7-10]. They suggested that the formation of semi-protective TiO2 and the escape of carbon deteriorated the oxidation resistance. However, further studies on the oxidation of Ti3AlxSi1-xC2 are needed, because the purity and size of the starting powders, the sintering temperature/time/method, and the composition (x in Ti3AlxSi1-xC2) in the powder metallurgically synthesized samples greatly influence the oxidation kinetics, mechanism, and scale structures. This study aimed to characterize the oxidation behavior of Ti3AlxSi1-xC2 (x=0.3, 0.5, 0.7) at 400-800 ┬░C for 6 months, which has not yet been adequately investigated. In this study, the oxidation characteristics of Ti3AlxSi1-xC2 were compared with those of pure titanium.
2. EXPERIMENTAL
Polycrystalline Ti3Al0.3Si0.7C2, Ti3Al0.5Si0.5C2, and Ti3Al0.7Si0.3C2 were synthesized by mixing TiCx (x=0.6, <45 ┬ĄmŽå), Al (<45 ┬Ąmf, 99.9% purity), and Si (<70 ┬ĄmŽå, 99.9% purity) powders at molar ratios of 3:0.7:0.3, 3:0.5:0.5, and 3:0.3:0.7, respectively, in a shaker mill for 10 min, and hot pressing into 19 mmŽå ├Ś 10 mm pellets at 1400 ┬░C under a pressure of 25 MPa for 60 min in flowing Ar gas [7-10]. Hot pressed pellets were cut into the required dimensions of 10 ├Ś 10 ├Ś 5 mm3, ground with 1000 grit SiC paper, ultrasonically cleaned in acetone and methanol, and oxidized at 400, 600, and 800 ┬░C for 0.5-6 months in air atmosphere using a muffle furnace. For comparison purposes, pure titanium coupons were simultaneously oxidized. The specimens were analyzed using a scanning electron microscope (SEM) equipped with an energy-dispersive spectrometer (EDS), a field-emission electron probe microanalyzer (EPMA), and a high-power X-ray diffractometer (XRD) with Cu-K╬▒ radiation at 40 kV and 150 mA.
3. RESULTS AND DISCUSSION
Figure 1 shows the SEM microstructures of synthesized Ti3AlxSi1-xC2. These specimens consisted of lamellar or somewhat equiaxed grains of micrometer size, which was typical in isostructural Ti3SiC2 [1,11], Ti3AlC2 [12], and Ti3AlxSi1-xC2 [7-10]. Average grain size was about 7.5 ╬╝m in length and 2.5 ╬╝m in thickness for Ti3Al0.7Si0.3C2, 4 ╬╝m in length and 2 ╬╝m in thickness for Ti3Al0.5Si0.5C2, and 3 ╬╝m in length and 1.5 ╬╝m in thickness for Ti3Al0.3Si0.7C2 Apparently, grains refined with the addition of Si, which might be closely related with the reactivity and diffusivity of starting materials during hot pressing. Using the image analyzer, the volume fraction of pores was measured as 1.5% for Ti3Al0.7Si0.3C2, 1.3% for Ti3Al0.5Si0.5C2, and 1% for Ti3Al0.3Si0.7C2 respectively, which suggested that the average density of Ti3AlxSi1-xC2 was 98.7%.
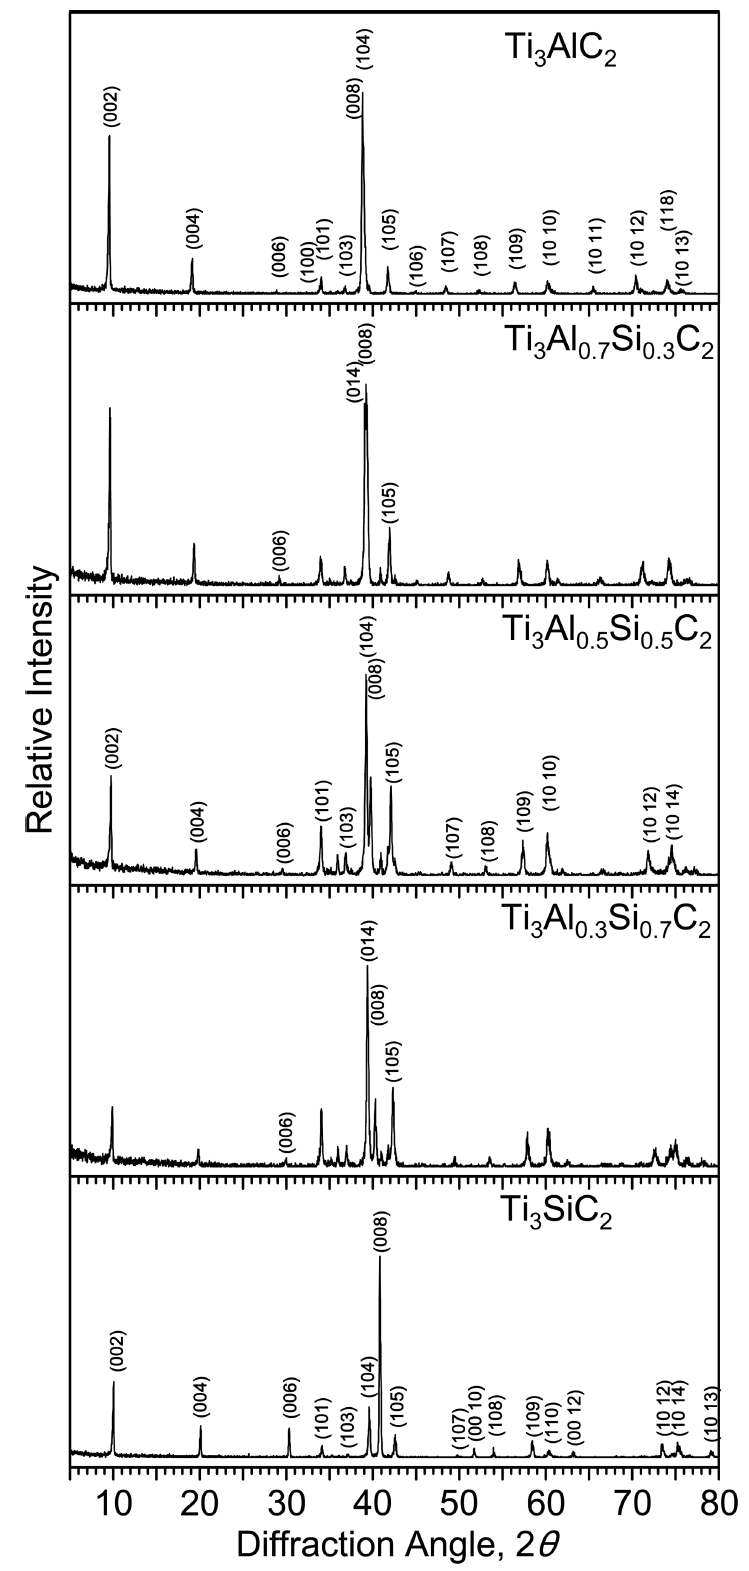
In general Ti3AlC2, Ti3AlxSi1-xC2, and Ti3SiC2 have a layered hexagonal structure. Silicon atoms partially substituted into the Al sites in Ti3AlC2 to form Ti3AlxSi1-xC2. Monolithic Ti3AlxSi1-xC2 was successfully synthesized, without any impurities under the detection limit of the XRD technique, as shown in Fig 2. Minor impurities in synthesized carbides are usually Ti2AlC and Al4C3 in case of Ti3AlC2, TiC, Ti5Si3 and SiC in case of Ti3SiC2, and unreacted raw materials such as SiC and graphite [13-16].
Figure 3 shows long-time oxidation curves of Ti3AlxSi1-xC2, which were obtained by measuring weight gains due to oxidation using a microbalance. Each data point was obtained from one specimen. Generally, weight increased more with the increment of oxidation time and temperature. At 400 ┬░C, Ti3Al0.7Si0.3C2 displayed the smallest weight gains for 0.5-3 months, but oxidized completely to powder at 6 months. At 600 ┬░C, Ti3Al0.7Si0.3C2 displayed modest weight gains for 0.5-3 months, but again oxidized to powder at 6 months. As such, pulverization of Ti3Al0.7Si0.3C2 during oxidation at (400, 600 ┬░C)/(6 months) resulted from oxidationinduced microcracking of oxide scales, as will be explained later. When microcracking of oxide scales and subsequent pulverization of samples were absent during oxidation at (400-600 ┬░C)/(6 months), simply the thickening of oxide scales proceeded, being similar to the oxidation of common metals. At 800 C, all Ti3AlxSi1-xC2 oxidized relatively fast at similar rates, without pulverization. Ti3Al0.3Si0.7C2 oxidized faster at 400 ┬░C than at 600 ┬░C. Such anomalous oxidation was also observed during oxidation of Ti3AlC2 at 400-900 ┬░C [17,18], Ti2AlC at 500-900 ┬░C [19], Ti3AlC2/TiC composites at 550ŌĆō950 ┬░C [20], and Ti3SiC2 at 650 ┬░C [21].
Basically, the oxidation behavior of Ti3Al0.3Si0.7C2, Ti3Al0.5Si0.5C2, and Ti3Al0.7Si0.3C2 at each test temperature of 400, 600, and 800 ┬░C is considered to be similar, considering anomalous oxidation kinetics, and experimental error that arouse owing to the diverse size and alignment of matrix grains and density difference in each specimen (Fig 1). Ti3AlxSi1-xC2 oxidizes according to the following equation [7-10].
(1)
The protectiveness of Ti3AlxSi1-xC2 mainly depends on the continuity and compactness of extremely slow-growing Al2O3 and SiO2. These oxides could not grow fast enough to suppress the growth and transformation of titanium oxides, and the microcracking of oxide scales at 400-600 ┬░C (see Figs 7b and 11b). The origin of oxidation-induced microcracking is the large volume expansion arisen owing to the eq. (1), which yielded large stress that could disintegrate Ti3AlxSi1-xC2 into powder at 400-600 ┬░C. At 800 ┬░C, Ti3AlxSi1-xC2 did not suffer microcracking due to the stress relaxation (see Figs 8 and 9). These figures show that Ti3AlxSi1-xC2 formed thick TiO2-rich oxide scales due mainly to fast oxidation of titanium, although Al2O3 and SiO2 still grew slowly at 800 ┬░C. The result obtained Fig 3 may be summarized as follows. The long-time oxidation resistance of Ti3AlxSi1-xC2 was poor due to microcracking of oxide scales and subsequent pulverization of samples at 400-600 ┬░C as well as fast oxidation of titanium in Ti3AlxSi1-xC2 at 800 C.
For comparison, titanium was subjected to the same oxidation conditions given in Fig 3, and the weight gains due to oxidation were measured as shown in Fig 4. Each data point was obtained from one sample. Titanium oxidized quite slowly at 400 ┬░C, moderately at 600 ┬░C, and extensively at 800 ┬░C. Hence, the oxidation limit of Ti is known to be 600 ┬░C [22]. Oxidation kinetics of Ti changed from parabolic to linear at 600-1000 ┬░C, transitioning earlier with the increment of temperature [23,24]. Titanium, which forms semi-protective TiO2, is not oxidation-resistant. It displayed better oxidation behavior than Ti3AlxSi1-xC2 at 400 and 600 ┬░C without pulverization. However, it oxidized much faster than Ti3AlxSi1-xC2 at 800 ┬░C (Figs 3 and 4).
Figure 5 shows XRD patterns of Ti3Al0.5Si0.5C2 after (400-800 ┬░C/3 months)-oxidation. At 400 ┬░C, strong matrix peaks and weak (rutile-TiO2, Ti3O)-peaks were detected, because of the thin scale formation. At 600 ┬░C, Ti3O disappeared while rutile-TiO2 peaks became slightly stronger, implying that transient Ti3O transformed to stable rutile-TiO2. At 600 ┬░C, matrix peaks were strong, because the scale was still thin. Alumina and silica, which formed according to eq. (1), were undetected due to their small amount or amorphous nature. When oxidized further at 800 ┬░C, matrix peaks were no longer detectable because a thick rutile-TiO2 scale covered the surface [17,18].
For comparison, titanium was oxidized under the same conditions given in Fig 5, and XRD data were acquired, as shown in Fig 6. When oxidized at 400 ┬░C, strong ╬▒-Ti matrix peaks and a faint anatase-TiO2 peak were detected, indicating that oxidation progressed so slowly that a superficial oxide scale formed. Under the same 400 ┬░C-oxidation, oxide peaks shown in Fig 5 were a little stronger than those shown in Fig 6, which suggested that Ti3Al0.5Si0.5C2 oxidized a little faster than Ti, as is noticeable from Figs 3 and 4. Also, anatase-to-rutile transformation occurred slightly faster in Ti3Al0.5Si0.5C2 than in Ti. Such an increased oxidation rate and enhanced anatase-to-rutile transformation of Ti3Al0.5Si0.5C2 at 400 ┬░C might be affected by the simultaneous oxidation of Al, Si, and carbon. At 400 ┬░C, TiO2 grew slowly, Al2O3 and SiO2 grew much more slowly, and CO2(g) liberated, which could affect the oxidation kinetics and TiO2-transformation in Ti3AlxSi1-xC2. The 600 ┬░C-oxidation revealed strong (rutile-TiO2, ╬▒-Ti)-peaks and relatively weak Ti3O peaks (Fig 6), which indicated that the oxide scale was relatively thin, and metastable anatase that was detected at 400 ┬░C transformed to stable rutile at 600 ┬░C [25,26]. Transient Ti3O was absent, and a thick scale consisting of rutile-TiO2 formed after 800 ┬░C-oxidation (Fig 6).
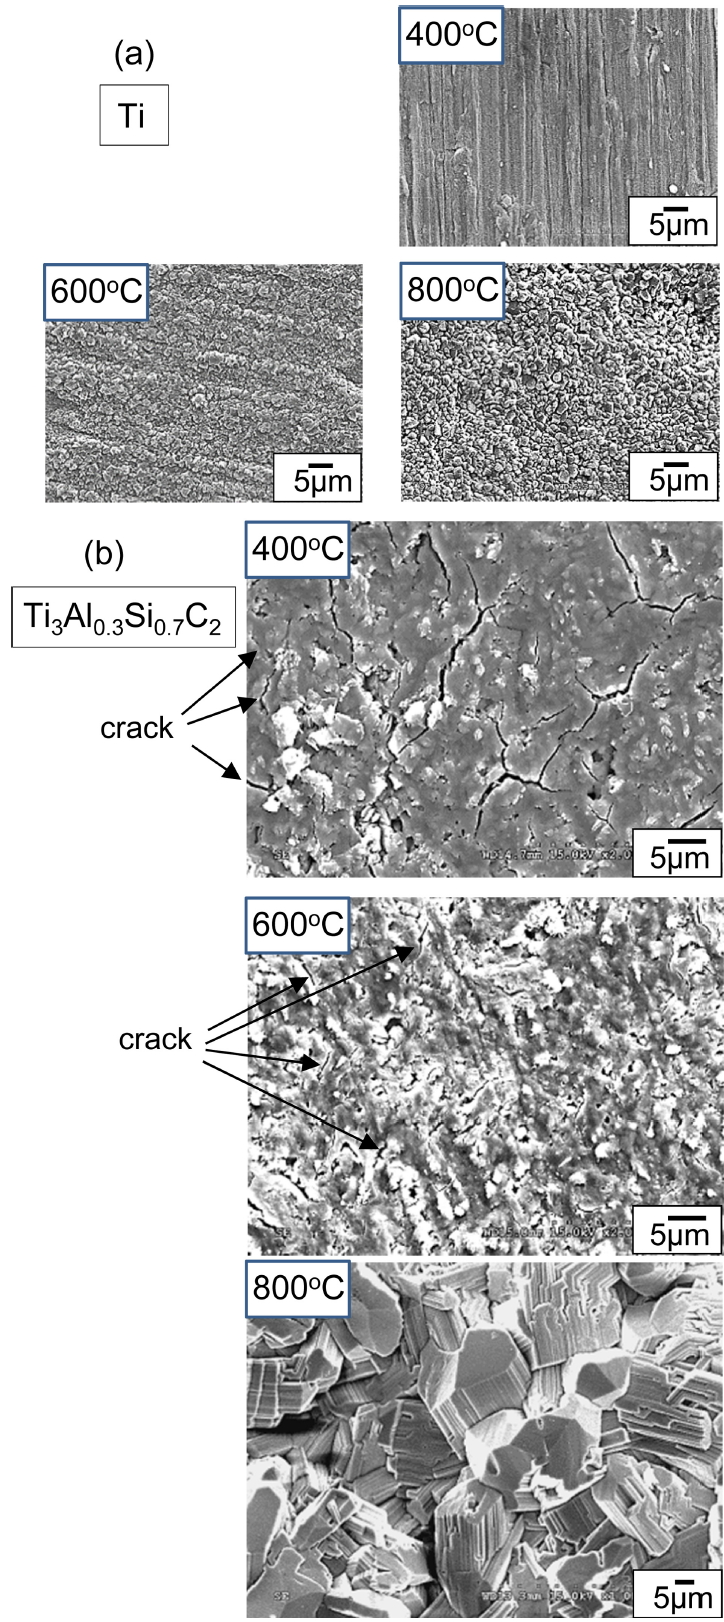
Surfaces of Ti3Al0.3Si0.7C2 after (400-800 ┬░C/3 months)-oxidation were compared with those of Ti, as shown in Fig 7. For Ti at 400 ┬░C, grinding grooves that formed during the sample preparation stage were visible because of the slow oxidation rate. Titanium oxides on Ti grew to micrometer sized round grains at 600 ┬░C. Rutile-TiO2 grains that formed at 800 ┬░C on Ti were still fine despite lengthy oxidation, because they continued to nucleate at the surface through outward diffusion of Ti4+ ions from the matrix [23-25]. By contrast, Ti3Al0.3Si0.7C2 suffered from the microcracking of the oxide scale at 400 ┬░C. The oxide scale that formed at 600 ┬░C on Ti3Al0.3Si0.7C2 was thin; however, short microcracks were visible. Unlike Ti, Ti3AlxSi1-xC2 was prone to microcracking and subsequent pulverization at 400-600 ┬░C (Fig 3). Oxidation-induced microcracking was similarly observed during the oxidation of Ti2AlC at 500-600 ┬░C for 20 h [19], Ti3SiC2 at 650 ┬░C for 10 h [21], and Ti3AlC2/TiC composites at 500-660 ┬░C for 20-40 h [17,20]. At 800 ┬░C, rutile-TiO2 on Ti3AlxSi1-xC2 grew to characteristic coarse, pillar-like grains, because not nucleation but grain growth of TiO2 dominated owing to partial deterrence of the outward diffusion of Ti4+ ions from the matrix by simultaneously formed Al2O3 and SiO2 [7-10]. The absence of Al2O3 and SiO2 was the reason for the much faster oxidation of Ti compared to Ti3AlxSi1-xC2 at 800 ┬░C (Figs 3 and 4).
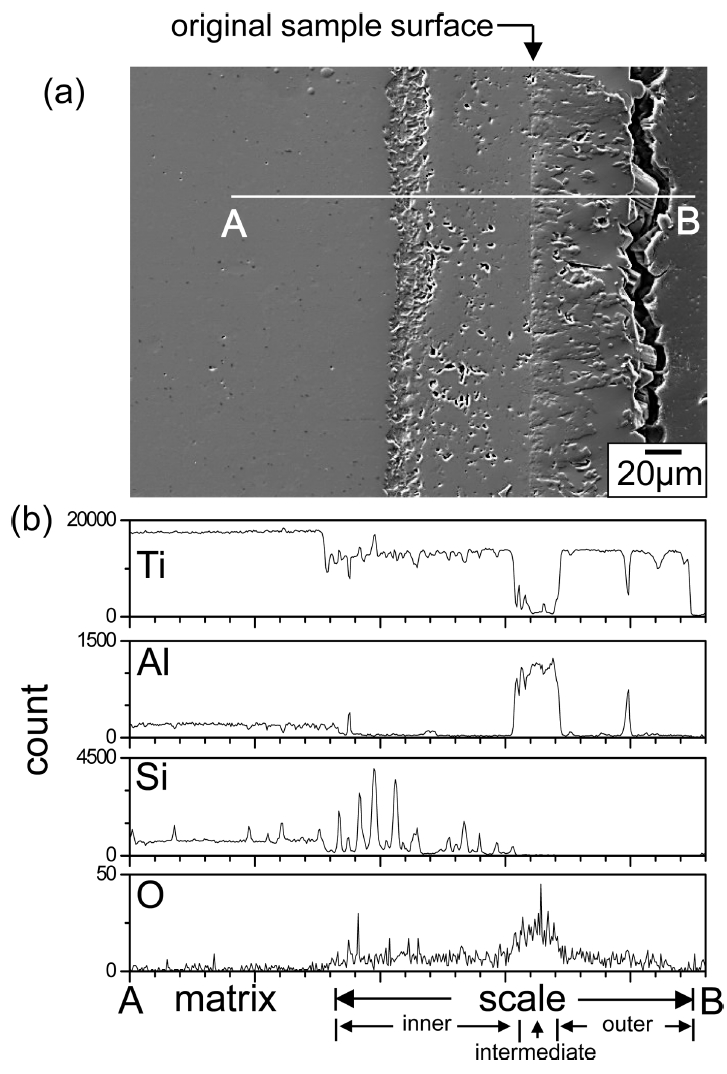
Figure 8 shows EPMA results of Ti3Al0.7Si0.3C2 after (800 ┬░C/3 months)-oxidation. The oxide scale consisted primarily of an outer TiO2 layer having a small amount of Al2O3, an intermediate Al2O3 layer having a small amount of TiO2, and an inner TiO2 layer having a small amount of (SiO2+Al2O3). There was sufficient Ti in Ti3Al0.7Si0.3C2 to form outer and inner TiO2ŌĆōrich layers. Since silicon oxidizes roughly in situ due to the high bonding energy of Si4+-O-2 [27], SiO2 can be treated as a marker to understand the oxidation mechanism [11,28]. Hence, it is seen that the flat interface between the intermediate Al2O3ŌĆōrich layer and inner TiO2ŌĆōrich layer corresponds to the original sample surface. The thickness of the oxide scale was ~ 140 ╬╝m, which varied to a certain extent depending on the location. Voids formed more in the thicker part of the oxide scale. They formed due to the Kirkendall effect caused by the outward diffusion of Ti4+ and Al3+ ions, the evolution of CO2, and anisotropic volume expansion during scaling [7-10]. Voids could act as easy-diffusion paths and stress concentrators.
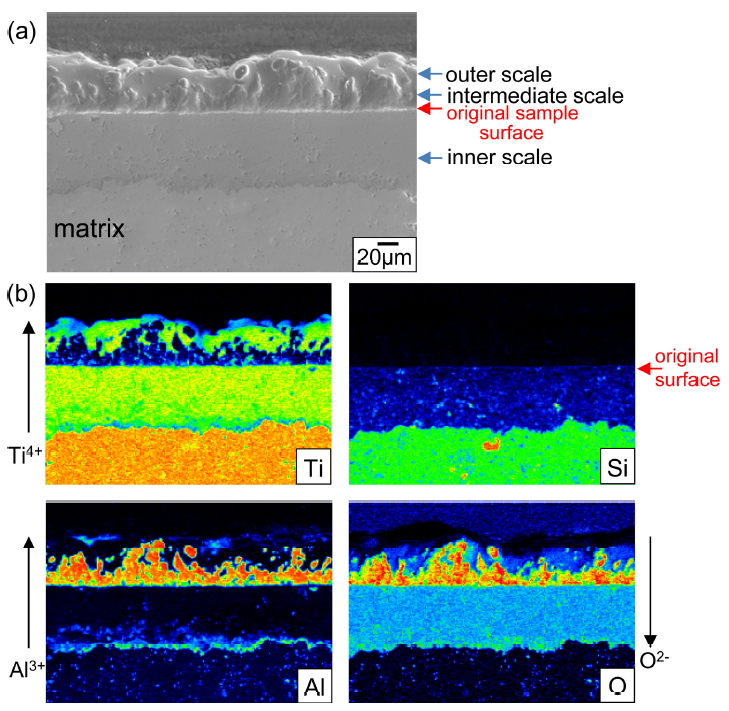
Figure 9 shows EPMA results of Ti3Al0.3Si0.7C2 that oxidized under the same condition given in Fig 8. The oxide scale with a thickness of ~ 125 ╬╝m consisted primarily of the outer TiO2 layer having some Al2O3, the intermediate Al2O3 layer having some TiO2, and the inner TiO2 layer having some Al2O3 and SiO2. The oxide scales shown in Figs 8 and 9 formed through the follow process.
Upon exposure to oxygen, titania, alumina, and silica formed competitively on Ti3AlxSi1-xC2, according to eq. (1). Nonstoichimetric TiO2 soon overgrew highly stoichiometric Al2O3 and SiO2, and constituted the outer scale. This process depleted Ti underneath, and thereby enriched Al, leading to formation of the intermediate Al2O3 scale, which in turn depleted Al and thereby enriched Ti underneath, resulting in formation of the inner TiO2 scale. It is noted that TiO2 grew by either outward diffusion of interstitial Ti4+ ions or inward diffusion of O2- ions via oxygen vacancies [29]. The outer oxide layer grew by outward diffusion of Ti4+ ions plus a small amount of Al3+ ions, the intermediate oxide layer grew by outward diffusion of Al3+ ions plus a small amount of Ti4+ ions, and the inner oxide layer containing some SiO2 grew by inward diffusion of O2- ions.
On the other hand, oxide scales that formed on Ti3SiC2 consisted of an outer TiO2 layer, an intermediate SiO2 layer, and an inner (TiO2+SiO2)-mixed layer [11], whereas those that formed on Ti3AlC2 consisted of an outer TiO2 layer, an intermediate Al2O3 layer, and an inner (TiO2+Al2O3)-mixed layer [12]. In this study, the intermediate layer consisted of not SiO2 but Al2O3, because of the low dissociation pressure of Al2O3 when compared to SiO2.
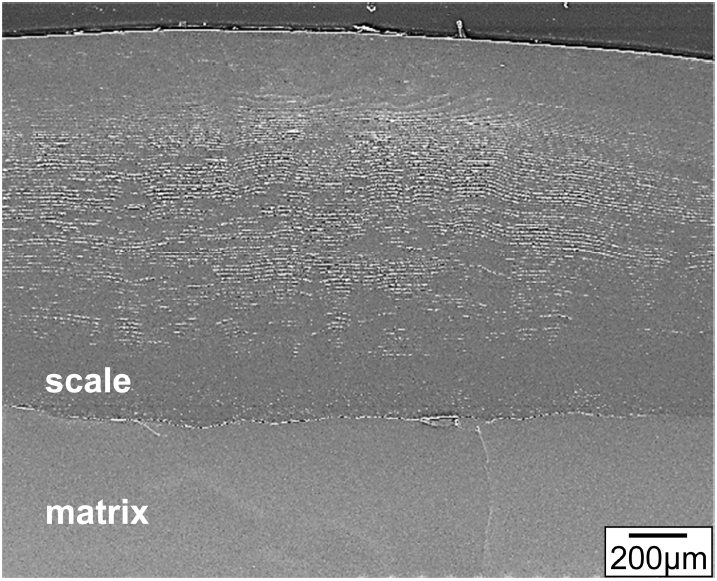
For comparison, titanium was oxidized under the same condition given in Figs 8 and 9, and the SEM result is shown in Fig 10. A laminated rutile-TiO2 oxide layer was seen. Its thickness varied in the range of 0.8-1.3 mm, depending on the location. Titanium gained the weight about six time more than Ti3AlxSi1-xC2 at 800 ┬░C, because it could not form Al2O3 and SiO2 (Figs 3 and 4).
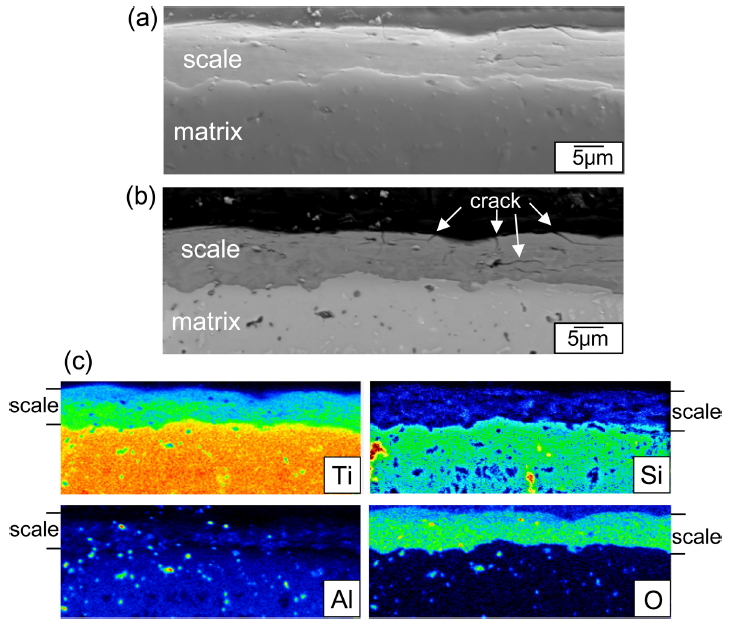
Figure 11 shows EPMA results of Ti3Al0.3Si0.7C2 after (400 ┬░C/3 months)-oxidation. This specimen displayed the weight gain of 1.8 mg/cm2 (Fig 3). Its surface displayed oxidation-induced microcracks (Fig 7b). The oxide scale was 9 ╬╝m-thick (Fig 11a), and had microcracks, which could facilitate the inward diffusion of oxygen (Fig 11b). At 400 ┬░C, Ti3AlxSi1-xC2 oxidized relatively slowly for 0.5-3 months (Fig 3). Unlike Figs 8 and 9, the oxide scale shown in Fig 11c could not develop into the triple-layered oxide scale, because of the slow diffusion and oxidation reaction. Additionally, the outward diffusion of cations was negligible, which could be recognizable from the location of SiO2 in the oxide scale (Fig 11c). Such resulted in the formation of the TiO2-rich oxide scale having rather uniformly distributed SiO2 and Al2O3, which was plausible considering that the ratio of Ti:Al:Si was 3:0.3:0.7.
4. CONCLUSIONS
The oxidation behavior of Ti3AlxSi1-xC2 at 400-800 ┬░C for 0.5-6 months was studied. During (400-600 ┬░C/6 months)-oxidation, oxidation-induced microcracking could lead to pulverization of Ti3AlxSi1-xC2, because oxidation of Ti3AlxSi1-xC2 to Ti3O, (anatase or rutile)-TiO2, Al2O3, SiO2, and CO2(g) induced a large volume expansion and thereby high stress in the oxide scales. During (800 ┬░C/0.5-6 months)-oxidation, microcracking and subsequent pulverization of Ti3AlxSi1-xC2 did not occur due to stress relaxation; however, Ti3AlxSi1-xC2 formed thick oxide scales consisting of an outer TiO2-rich layer, an intermediate Al2O3-rich layer, and an inner TiO2-rich layer owing to enhanced oxidation and diffusion rates.