


1. Introduction
There is a growing social demand for flexible and wearable electronic devices for diverse applications, such as personal portable devices, artificial skin, and health monitoring devices [1,2]. Flexible sensors based on the piezoelectric effect are more advantageous than flexible sensors based on other sensing mechanisms because of their self-powering capability. Piezoelectric materials convert external mechanical stimuli into electricity through an electro-mechanical coupling effect; therefore, piezoelectric sensors do not require an external power source [3,4].
Piezoelectric materials can be classified into inorganic and organic materials. Typical inorganic materials are lead-based ceramics such as PZT, PLZT and PMN [5]. Recently, intensive research has been devoted to searching for lead-free piezoelectric ceramics, and BaTiO3(BTO) and (K,Na)NbO3 are considered to be promising candidates [6,7]. Although the piezoelectric coefficients of these ceramics are outstanding, these materials are not suitable for application to flexible electronic devices due to their brittleness. Accordingly, they are typically incorporated in the form of a nanomaterial into polymer matrices such as polydimethylsiloxane (PDMS) and polymethyl methacrylate (PMMA) [8,9]. In such cases, it is very important to ensure the uniform dispersion of the nanomaterials in the polymer matrix for a highly sensitive piezoelectric device. Additionally, electric poling is an essential process to activate the piezoelectricity in flexible electronics that are based on piezoelectric ceramic nanomaterials.
Organic piezoelectric materials are represented by polyvinylidene fluoride (PVDF) and its copolymers [10]. Although the piezoelectric coefficient d33 of PVDF (−24 to − 34 pC/N) [11] is relatively small compared to those of PZT (225 to 590 pC/N) [12] and BTO (191 pC/N) [13], polymer piezoelectric materials are suitable for flexible electronic devices. PVDF is a semi-crystalline polymer, and its piezoelectricity is dependent on its five distinct crystalline phases (α,β,γ,δ, and ε) [10]. In PVDF, the largest degree of spontaneous polarization can be found in the β phase [14]. Unlike piezoelectric ceramics, in PVDF, polarization can be induced by stretching [15] as well as electric poling [16]. Electrically poled PVDF can be facilely fabricated in a nanofiber form through an electrospinning process [17].
Recently, research has been conducted to develop flexible piezoelectric pressure sensors based on ceramic-PDMS composite films and electrospun PVDF nanofiber mats [4,18]. However, there has been no comparative study of the piezoelectric performance capabilities of these two types of pressure sensors. For instance, under a compressive force condition, the maximum output voltage of a PVDF nanofiber mat was found for a mat thickness of 70 μm [17]. However, the maximum piezoelectric performance of a ceramic-PDMS composite film with a similar structure has not been reported. Moreover, electric poling is an essential process for ceramic-PDMS composite films, to activate the piezoelectric effect. However, the effects of electric poling on these two types of pressure sensors have not been systematically investigated.
In the present work, we investigated the effect of external electric poling on a ceramic-PDMS composite film and a PVDF nanofiber mat. BTO nanoparticles were used as a representative piezoelectric ceramic material. For a systematic analysis, the open-circuit voltage (Voc) in response to compressive force was measured while varying the poling intensity and time of BTO-PDMS composite films with 20 ‒ 40 wt.% of BTO content. Additionally, subsequent poling was conducted while varying the electric field strength of a PVDF nanofiber mat that had been initially poled during an electrospinning process, and Voc in response to compressive force was then measured. Finally, flexible piezoelectric pressure sensors based on BTO-PDMS composite film and a PVDF nanofiber mat with a thickness of 70 μm were fabricated, and we investigated the compressive force and strain rate dependencies of Voc and the short-circuit current (Isc) for these two types of pressure sensors.
2. Experimental Methods
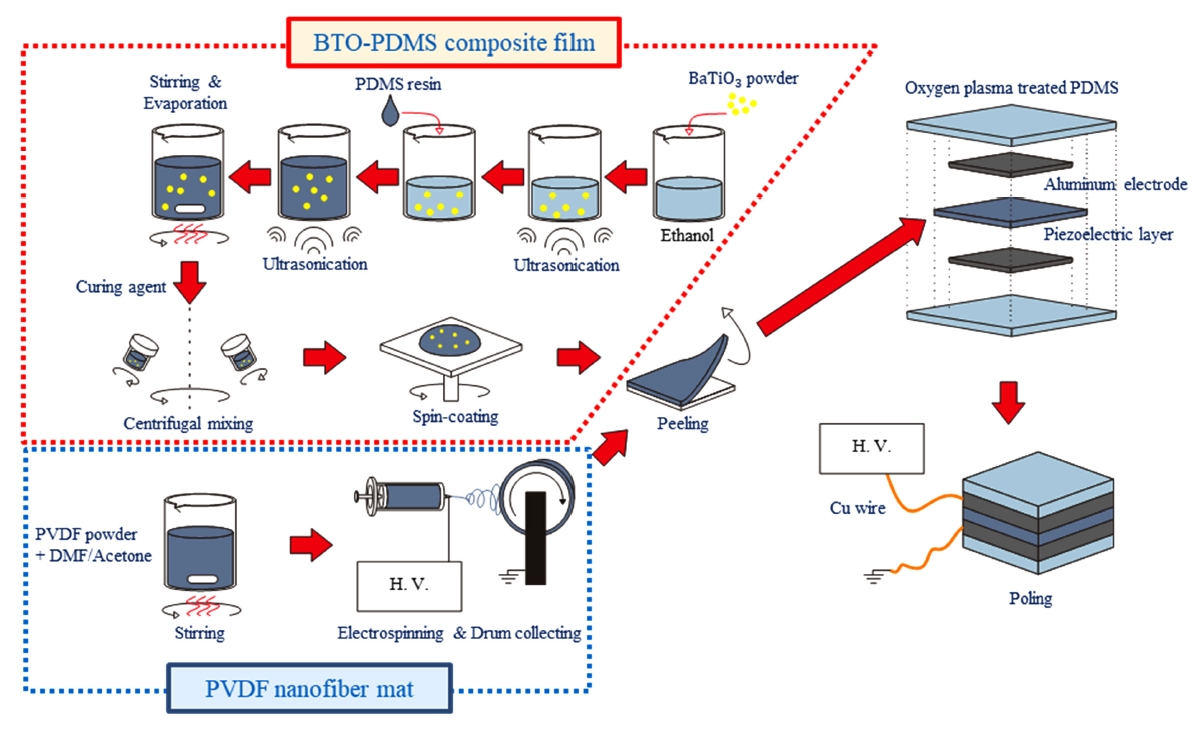
BTO-PDMS composite films were fabricated by mixing and spin-coating processes, as described in Fig 1. BTO nanoparticles with a diameter of 200 nm (US Research Nanomaterials, USA) were dispersed ultrasonically in ethyl alcohol (Duksan, Korea) for 30 minutes. After adding poly(dimethyl siloxane) resin (Sylgard 184 Silicone Elastomer Kit, Dow Corning, USA) to the solution, another ultrasonication process was applied for 10 min. The solution was then stirred with a magnetic bar at 50 ºC until the solvent was evaporated. To obtain a well-mixed composite, a planetary centrifugal mixing process was carried out at 1000 rpm for 10 min after adding a curing agent (10 wt% of PDMS resin). The composite was subsequently deposited onto a plastic petri dish by means of a spin-coating process at a rate of 200 rpm or 1500 rpm depending on the targeted thickness for 1 min. Finally, the composite layer was degassed and fully cured in a vacuum oven at 80 ºC for 1 h.
Meanwhile, poly(vinylidene fluoride) (PVDF) nanofiber mats were fabricated using an electrospinning method (See Fig 1). In this case, a 20 wt.% PVDF (MW = ~534,000, Sigma-Aldrich, USA) solution was prepared by dissolving PVDF power into a 4/6 (v/v) mixture of acetone (Duksan, Korea) and N,N-dimethylformamide (Duksan, Korea) on a hot plate at 100 ºC for 3 hr. The solution was infused at a flow rate of 1 ml/h through a 27-gauge metal needle, and a voltage of 15 kV was applied to the 15 cm distance between the needle and the grounded aluminum drum collector used during this process.
The BTO-PDMS composite film and PVDF nanofiber mat were subsequently sandwiched between the two PDMS layers with an aluminum electrode, as shown in Fig 1. The thickness of the PDMS layer was approximately 400 μm, and the aluminum was deposited using a DC magnetron sputtering system. Copper wires were attached to the aluminum electrodes. It should be noted that in the present study aluminum thin film was used as the electrode for a facile fabrication process, although it is inappropriate for pressure sensors that require great flexibility. For actual flexible sensors, flexible electrodes based on a metal nanotrough network [19] or sprayed metal nanowires [18] could be integrated into the devices. Finally, the piezoelectric active layers were electrically poled using a ferroelectric measurement system (TF Analyzer 1000) and a high-voltage power amplifier (Trek Model 10/10B-HS) at room temperature.
In an electrospinning process, application of high voltage to the polymer fluid is essential to overcome the surface tension [4]. The PVDF nanofiber mat exhibited piezoelectricity following phase transition to the β-phase during the electrospinning process. In the present study the feasibility of enhancing piezoelectric effect of PVDF nanofibers via a post treatment with electric field was investigated.
A high-resolution field emission scanning electron microscope (HR FE-SEM, SU8010, Hitachi) was used to observe the morphology of the BTO nanoparticles, the BTO-PDMS composite, and the electrospun PVDF nanofibers. An X-ray diffractometer (XRD, DE/D8 Advance, Bruker) using Cu-Kβ radiation was used to identify the crystal structures of the BTO nanoparticles and PVDF nanofibers. A Fourier transform infrared spectrometer (FTIR, Nicolet iS50, Thermo Scientific) was used to identify the crystalline phases of the PVDF nanofibers [20-23]. The output voltages and currents of the piezoelectric sensors were measured using a source meter (2602B, Keithley Instruments) under a periodic compressive force generated by a pushing tester (JIPT-100, Junil Tech).
3. Results and Discussion
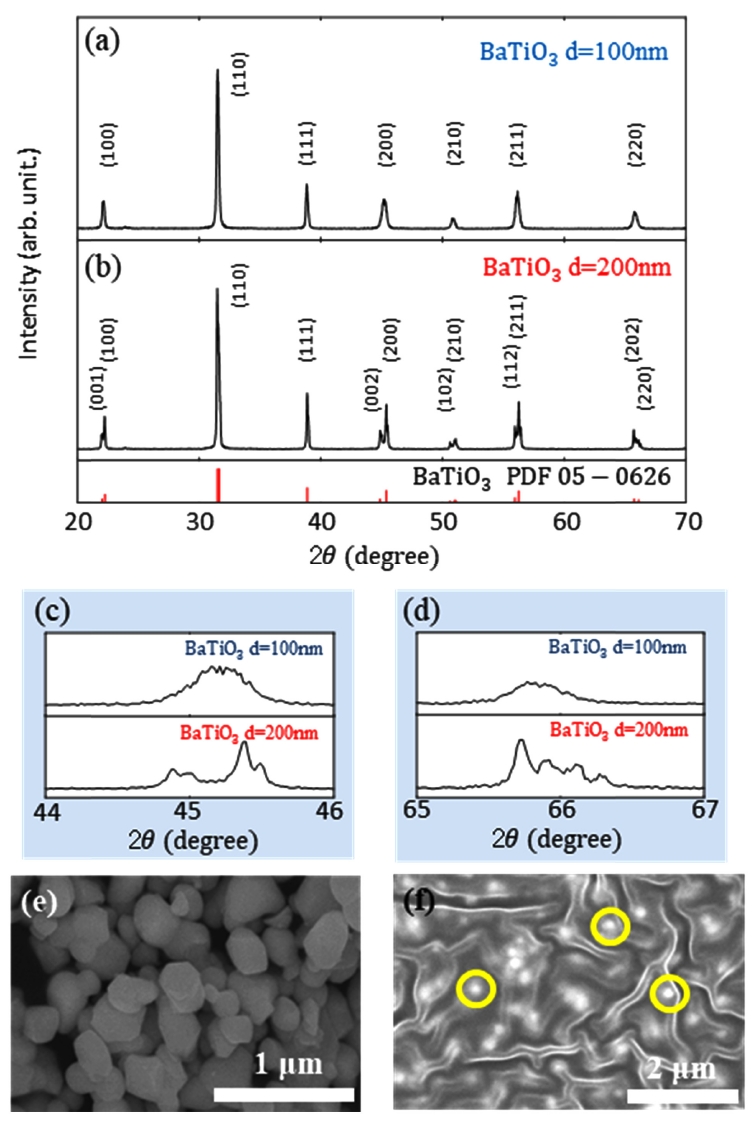
Figs 2(a) and 2(b) present the XRD patterns of BTO particles with 100 nm and 200 nm diameters, respectively. First, it can be clearly observed that the (200) and (220) peaks in Fig 2(a) are differently shaped, as shown in Fig 2(b). The magnified peak profiles at 2θ = 44° − 46° and 65° − 67° are shown in Figs 2(c) and 2(d), respectively. As previously reported by Hsiang et al. [24], the (200) and (220) peaks in the cubic phase are split into (002)/(200) and (202)/(220) peaks in the tetragonal phase. Therefore, BTO particles with a 100 nm diameter are in the cubic phase, while those with a 200 nm diameter are in the tetragonal phase. The split peaks in the BTO particles with a 200 nm diameter at 2θ = ~45° (Fig 2(c)) also imply that the BTO particles with a 200 nm diameter are in a multi-domain state. Multi-domain crystallites have much lower activation energy for domain reorientation than single-domain particles [24,25]. Therefore, in the present work, BTO particles with a 200 nm diameter were used to enhance the electric poling efficiency.
The SEM images in Figs 2(e) and 2(f) correspondingly show the BTO particles and the BTO-PDMS composite film with 40 wt.% BTO content. In Fig 2(f), each white dot marked with a yellow circle represents agglomerated BTO nanoparticles. The agglomeration of BTO particles in the PDMS matrix can be locally observed due to the low chemical bonding between the BTO particles and the polymer matrix [26]. Meanwhile, curvy lines can be observed from the PDMS surface using scanning electron microscopy.
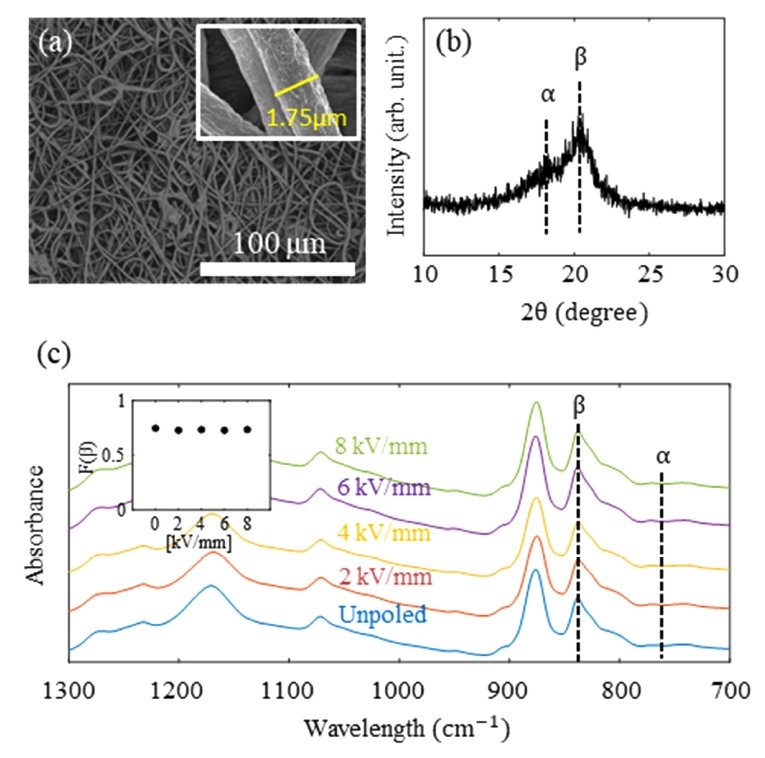
Fig 3(a) shows a SEM image of the PVDF nanofibers fabricated via the electrospinning process. During the deposition of the PVDF nanofibers onto a grounded drum collector, the α phase is transformed into the β phase via in situ electric poling and mechanical stretching [10]. As shown in the inset of Fig 3(a), the diameters of the PVDF nanofibers were ~1.75 μm. Meanwhile, Fig 3(b) presents the XRD pattern of the electrospun PVDF nanofibers. The diffraction peaks at 2θ = 17.8º and 20.6º indicate the (100) plane of the α phase and the sum of the (110) and (200) planes of the β phase, respectively [27]. Fig 3(c) presents the FTIR spectra of the PVDF nanofiber mats exposed to a 0 ‒ 8 kV/mm electric field for 15 min. It can be clearly observed that the β phase intensity at 840 cm-1 is dominant and that the α phase intensity at 761 cm-1 can scarcely be identified. The β phase content F(β) can be computed by [28]
where Aα and Aβ are the absorbance intensities at 761 cm-1 and at 840 cm-1, respectively. The absorbance coefficients Kβ (6.1 × 104 cm2/mol) and Kβ (7.7 × 104 cm2/mol) can be found in the literature [17]. The effect of poling intensity on F(β) is shown in the inset of Fig 3(c). Here, ex situ poling with a 2 ‒ 8 kV/mm electric field on the electrospun PVDF nanofiber mats had no considerable effect on F(β).
The effect of the electric field intensity and poling time on the Voc value of the BTO-PDMS composite film was studied at room temperature. First, the effect of the electric field intensity on the BTO-PDMS composites with 20 ‒ 40 wt.% of BTO content was investigated using a step-wise poling process. The applied electric field intensity was gradually increased from 2 kV/mm to 10 kV/mm in 2 kV/mm steps, and after each poling step the peak-to-peak Voc was measured under a 10 N compressive force and a frequency of 1 Hz. As shown in Fig 4(c), Voc was enhanced as the BTO content was increased from 20 wt.% to 40 wt.% for all of the electric field intensity levels. Furthermore, regardless of the BTO content, the rate of the peak-to-peak Voc increased as the increase in the electric field intensity gradually decreased. By poling with a 10 kV/mm electric field for 15 minutes, the maximum peak-to-peak Voc of the composite with 40 wt.% of BTO content was found to be just under 2 V. It should also be noted that in each poling step, the electric field was applied for 15 min.
In tetragonal BTO, electric polarization can occur in one of the six <100> directions. The BTO particles dispersed in the PDMS matrix are randomly oriented. The potential energy (UE) of polarization (P → E → - P → · E →
Composites with BTO contents exceeding 40 wt.% were not considered in this study for two reasons. First, electrical breakdown tends to occur more frequently during the poling process as the content of BTO particles increases. It is known that well dispersed particles in a polymer matrix disturb the growth of electrical trees, enhancing the breakdown strength [30,31]. However, an excessive amount of particles results in agglomeration; consequently, electron tunneling through the polymer is more likely to take place. Second, the mechanical properties of the BTO-PDMS composites, such as the tensile strength and elongation at break, deteriorate with an increase in the content of BTO particles [32,33]. For the remainder of this study, we used a BTO-PDMS composite with a 30 wt.% of BTO content as the optimal composition.
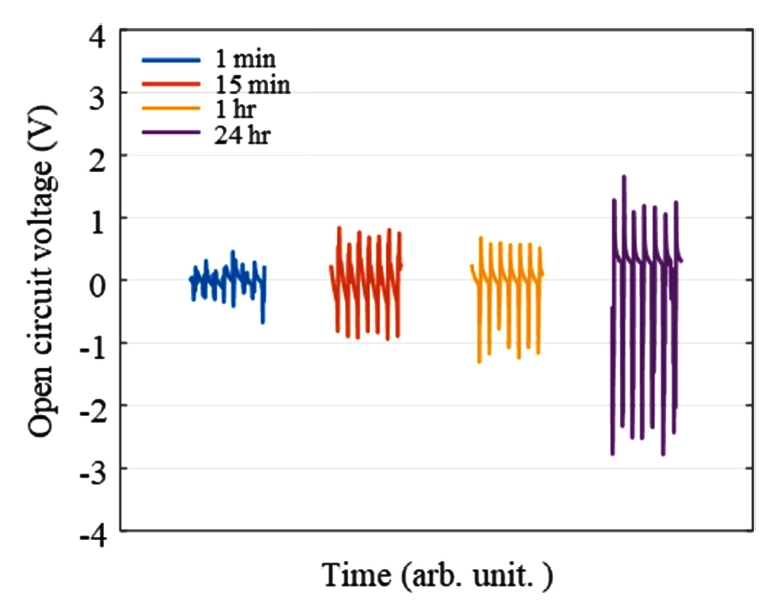
For ferroelectric ceramics, electric poling is an essential process to enhance piezoelectric performance. For BTO-PDMS composites, the effect of poling time on piezoelectric performance has yet to be systematically studied. Thus, we investigated the effect of poling time on the Voc of BTO-PDMS composites with 30 wt.% of BTO content under a compressive force of 10 N and a frequency of 1 Hz.
As shown in Fig 5, after poling with an 8 kV/mm electric field for 15 min, the peak-to-peak Voc of the BTO-PDMS sample increased noticeably to ~2 V from the peak-to-peak Voc, which corresponded to 1 min of poling time. Voc did not increase further after poling for 1 hr. Finally, when the composite was electrically poled for 24 hr, the peak-to-peak Voc increased to ~4 V. This result clearly indicates that the piezoelectric performance of BTO-PDMS composites can be greatly enhanced by increasing the poling time to 24 hr.
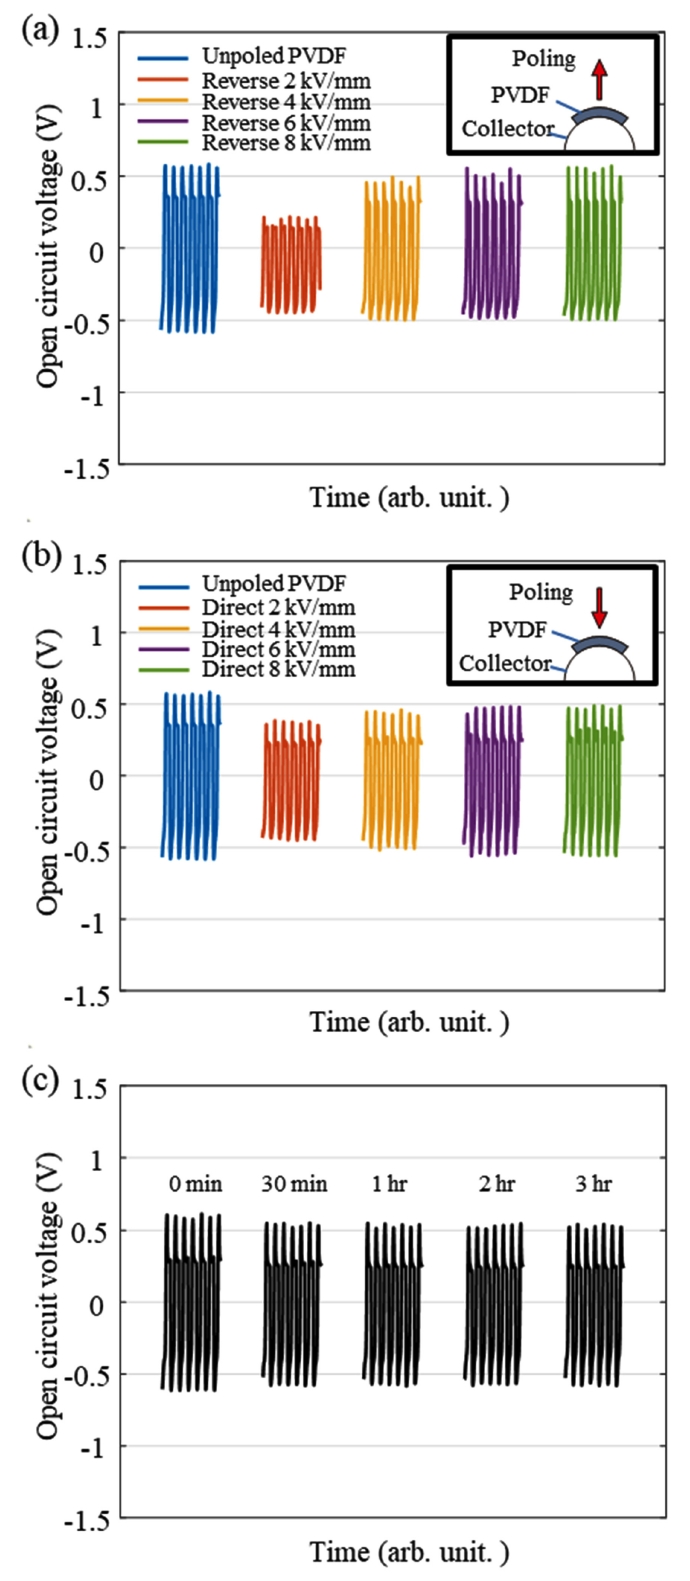
Meanwhile, the PVDF nanofibers were electrically poled during the electrospinning process. We investigated the effects of subsequent poling on the Voc of the PVDF nanofiber mat. For the PVDF nanofiber mat, electric poling was gradually carried out from 2 kV/mm to 8 kV/mm in 2 kV/mm steps, and Voc was measured after each poling step under 10 N of compressive force and a frequency of 1 Hz. It should be noted that poling was conducted during each step for 15 min. Given that the polarization direction in electrospun PVDF nanofiber has not been clearly determined [16,34], we applied the electric field in opposite directions to the two samples of the PVDF nanofiber mat. Figs 6(a) and (b) show the Voc when the electric field was applied according to the schematics (see the inset in each figure). As anticipated, the unpoled PVDF nanofiber mat exhibited a peak-to-peak Voc of approximately 1 V. However, Voc decreased when it was poled under a 2 kV/mm electric field for 15 min, as shown in Fig 6(a). With a gradual increase in the electric field intensity to 8 kV/mm, the peak-to-peak Voc increased gradually to ~ 1 V. A similar effect after subsequent poling of the PVDF nanofiber mat can clearly be observed, when the electric field was applied in the opposite direction (Fig 6(b)). It should be noted that this step-wise poling and the subsequent measurement of Voc were carried out after 30 min intervals. We also observed the variation in Voc in a PVDF nanofiber mat every 30 minutes without any poling process.
Fig 6(c) shows that the Voc in the unpoled PVDF nanofiber mat remained at a constant level with no noticeable degradation. Fig 6 indicates that the maximum Voc was obtained from the PVDF nanofiber mat that was poled in situ during the electrospinning process. Additionally, Voc was not enhanced further by subsequent poling at an electric field intensity level of 8 kV/mm for 15 min.
It has been reported that PVDF nanofiber mats exhibit the maximum piezoelectric output voltage at a thickness of 70 μm [17]. Thus, we prepared a BTO-PDMS composite film and a PVDF nanofiber mat with thicknesses of approximately 70 μm, and compared the compressive force and strain rate dependencies of Voc and Isc. Here, the BTO-PDMS composite film was poled by an 8 kV/mm electric field for 24 hr, and the PVDF nanofiber mat poled during the electrospinning process was not subsequently exposed to an electric field.
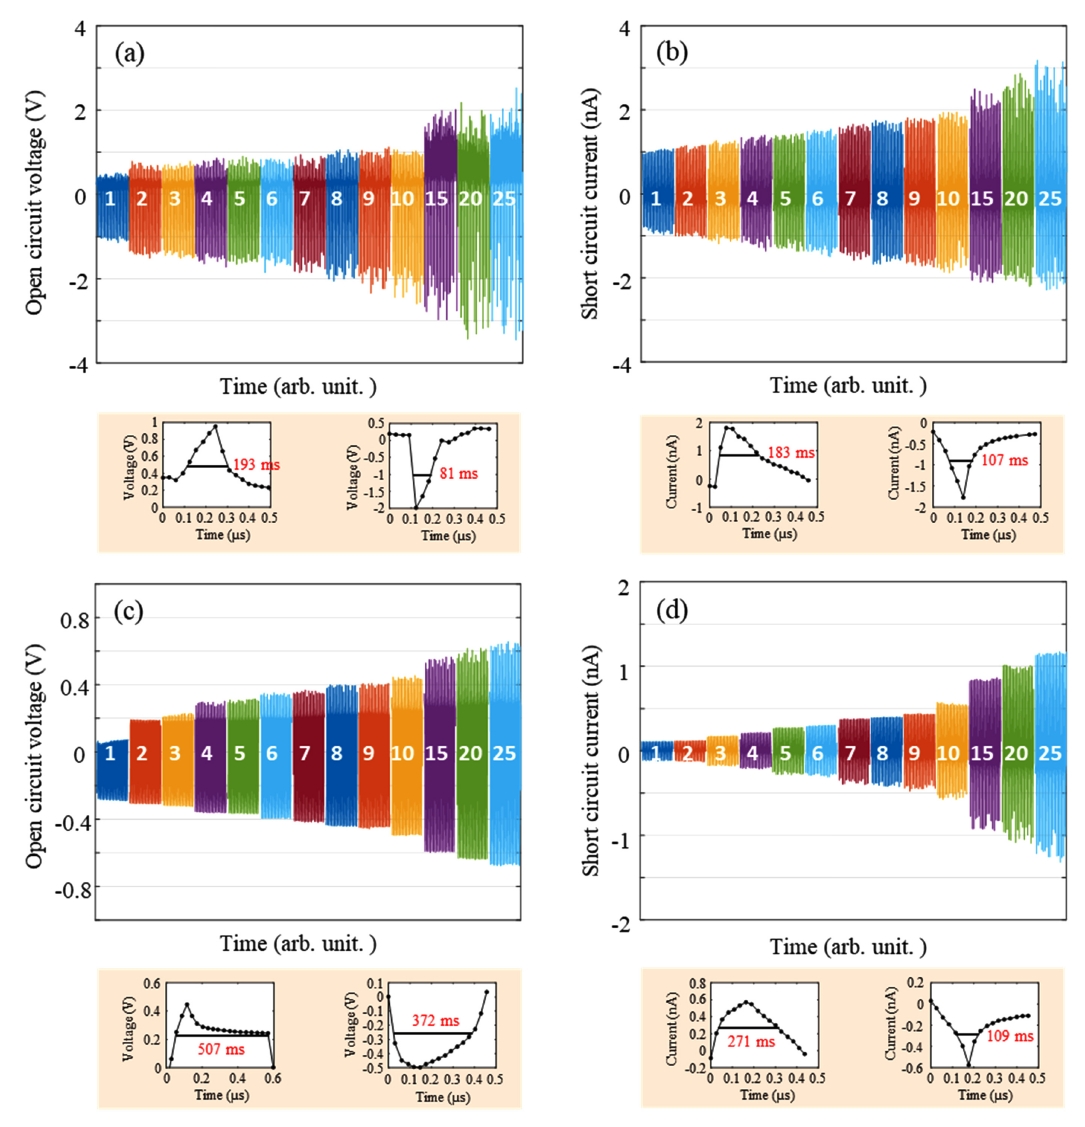
As shown in Fig 7, the Voc and Isc from the BTO-PDMS composite film exceeded those from the PVDF nanofiber mat in a 1 ‒ 25 N force range and under a pushing frequency of 1.0 Hz. However, the PVDF nanofiber mat showed some advantages over the BTO-PDMS composite film in terms of the stability of the Voc and Isc signals in response to compressive force. For example, the Voc signals from the BTO-PDMS composite film (Fig 7(a)) were less regular compared to those from the PVDF nanofiber mat (Fig 7(c)). This difference between the two piezoelectric pressure sensors originates from the difference in the lifetime of the signals. We measured the full width at half maximum (FWHM) of the Voc and Isc signals, as shown in Fig 7. The FWHM values for the Voc of the BTO-PDMS composite film were only 193 ms and 81 ms, while those of the PVDF nanofiber mat were 507 ms and 372 ms. Therefore, the lifetime of the Voc signal from the PVDF nanofiber mat was long enough to be reliably taken from samples using a source meter; hence, the discrete Voc signals were relatively regular.
The difference in the Isc signals of the BTO-PDMS composite film and the PVDF nanofiber mat likely had the same cause. In general, a piezoelectric nanogenerator connected to an external load can be treated as a simple RC circuit [35]. Therefore, the time constant (τ) can be increased by increasing the resistance or capacitance of the piezoelectric material. The large difference in the FWHM values of Voc and Isc for the BTO-PDMS composite film and the PVDF nanofiber mat originates from the difference in their internal capacitance and resistance. It should be noted that the FWHM values can be increased or decreased to some extent by incorporating metallic fillers into the PDMS or PVDF matrix.
Meanwhile, it is known that Voc and Isc in a piezoelectric device are highly dependent on the strain rate [36]. In general, the current (I) is related to the stress (T) or the strain (S) via
where d is the piezoelectric coefficient [36]. Thus, the current produced from a piezoelectric material is proportional to the time derivative of strain, that is, strain rate. Thus, the strain rate dependencies of Voc and Isc were investigated for the BTO-PDMS composite film and the 70 μm thick PVDF nanofiber mat. In addition, the BTO-PDMS composite film was poled by an 8 kV/mm electric field for 24 hr, and the PVDF nanofiber mat, which had been poled during the electrospinning process, was not subsequently treated by an electric field.
Voc and Isc were measured under a compressive force of 10 N and a frequency range of 0.5‒2.0 Hz. When the pushing frequency was increased from 0.5 Hz to 2.0 Hz, the Voc and Isc of the BTO-PDMS composite film and the PVDF nanofiber mat increased (Fig 8). To be more specific, when the pushing frequency increased from 0.5 Hz to 2.0 Hz, the Voc of the BTO-PDMS composite film and the PVDF nanofiber mat increased by 170.4% and 180.0%, respectively. Additionally, the Isc of the BTO-PDMS composite film and the PVDF nanofiber mat showed increases of 374.7% and 501.5%, respectively. Overall, the Voc and Isc signals of the BTO-PDMS composite film were larger than those of the PVDF nanofiber mat in the 0.5 ‒ 2.0 Hz frequency range.
4. Conclusion
In the present study, a comparative analysis of BTO-PDMS composite film and PVDF nanofiber mat samples was conducted to evaluate their application to a flexible piezoelectric pressure sensor. XRD measurements of the BTO particles showed that BTO particles with a diameter of 200 nm were in a multi-domain state, which facilitated polarization switching by an external electric field. The FTIR spectra of the PVDF nanofiber mats showed a dominant β phase intensity at 840 cm-1, indicating a phase transformation had occurred from the α phase to the β phase during the electrospinning process. For BTO-PDMS composite films with 20 ‒ 40 wt.% of BTO content, an electric field was externally applied up to 10 kV/mm. The 1.8 V peak-to-peak Voc was measured from the BTO-PDMS composite with a 30 wt.% BTO content that was poled by a 10 kV/mm electric field for 15 min. Additionally, the peak-to-peak Voc of the BTO-PDMS composite film increased considerably, to approximately 4 V, when the poling time was extended to 24 hr. On the other hand, the Voc of the PVDF nanofiber mat was not enhanced further by subsequent exposure to an electric field.
In general, the Voc and Isc values of the BTO-PDMS composite film exceeded those of the PVDF nanofiber mat in the force range of 1 ‒ 25 N and frequency range of 0.5 ‒ 2.0 Hz. However, the lifetimes of the Voc and Isc signals generated from the PVDF nanofiber mat were much longer than those from the BTO-PDMS composite film, meaning that the Voc and Isc signals generated from the PVDF nanofiber mat were more stable than those from the BTO-PDMS composite film.