


1. Introduction
The demand for lithium-ion batteries (LIBs) is increasing for applications in electric vehicles (EVs), portable electronic devices, utility power grids, etc., because they provide high energy and power densities, a long stable cycle life, and good safety performance [1-4]. LIBs typically require electrode materials with high theoretical capacities, good conductivity, and high structural stability. Currently, graphite (with a theoretical capacity of ~372 mAh g-1) is used as a conventional anode material for LIBs, but has difficulty meeting the high energy and power densities needed for practical applications [5]. For this reason, alternative non-carbonaceous anode materials have been investigated for high-capacity and high-performance LIBs. Among them, Si is currently considered the most suitable anode material because of its high theoretical capacity of 4200 mAh g-1, which is ten times more than traditional graphite anode. In addition, Si has a low working potential of around 0.4 V vs. Li+/Li, which avoids lithium metal deposition upon overcharge. Si is also highly abundant in the earth’s crust and environmentally benign, which further supports its practical use in high energy/power density applications [6-8]. However, Si experiences large volume changes during the Li+ insertion/extraction process, causing heavy mechanical stress and active material cracking, leading to an unstable solid electrolyte interphase (SEI) leading to rapid capacity fading. The structural destruction of the active material and low intrinsic conductivity further hampers overall battery performance [9-11]. Previous reports have suggested that the internal cracking of electrodes, pulverization of the active material, and ever-growing SEI layer are critical factors that promote battery degradation [12,13].
Different strategies have been developed to address these drawbacks of the Si anodes. Reducing the size of the silicon particles from bulk to nano-size, and creating different nano-structures, are reported to be effective ways of controlling the structural and morphological damage, and improving cycling performance [14-17]. Coating the Si particles with carbon, or fabricating Si/carbon composites, are also prominent strategies for avoiding the drawbacks of bare Si anode materials. The large buffer volume provided by the carbon in the composite material effectively controls the large volume changes in the Si during the Li+ alloying and dealloying processes. Also, the high electrical conductivity of the carbon matrix improves Li+ diffusion properties, by providing more charges during Li+ reactions [18-21].
Different types of carbon sources such as polyvinyl pyrrolidone, polyacrylonitrile, and polyvinylidene fluoride have been used as precursors for the carbon coated on Si particles [22-24]. These chemicals are not eco-friendly and require multi-step synthesis procedures with relatively long reaction times. As a result, there are still challenges to producing Si-carbon composites as functional negative electrode materials for LIBs.
With this perspective, we chose gelatin as a new potential carbon precursor, because of its high carbon composition, non-toxicity, bio-compatibility, and low cost [25]. Limited research has been performed using gelatin as a carbon source. In a previous report, Ulfa et al. prepared mesoporous carbon with a high specific surface area from gelatin as the source of carbon using a hard template technique [26]. Jiang et al. reported an Si anode modified with carbonized gelatin binder, which demonstrated good electrochemical performance by providing uniform dispersion of the Si particles in the carbon matrix. The composite delivered 990.3 mAh g-1, at 100 mA g-1 after 70 cycles.
It is also evident that nitrogen (N) doping of the carbon material can significantly increase its electrical conductivity, which is highly beneficial for long cycle life and superior rate performance [27,28]. For N doping we selected melamine, which is a good source of N, with non-toxicity and low cost [29].
Inspired by these findings, we prepared uniformly carbon-coated Si NPs using a simple two-step approach. To form a uniform coating on the Si particles, firstly, we modified the surface of the Si particle with citric acid as the modifying agent, because it has multiple functional groups (-COOH, -OH) which can ensure strong interactions with the Si NP. So, that it can form an active surface after modification by forming silyl esters (-Si-O-C(O)-C-) as per previous reports [30,31,32]. Later we used the gelatin/melamine combination to form an organic layer, firmly attached on the Si’s surface by bonding with silyl groups. High-temperature carbonization was used to make the N-doped carbon coating on the Si’s surface. The prepared hybrid Si/carbon composite was investigated as an anode for LIBs, and it showed excellent electrochemical properties, which were attributed to the synergetic effects of the Si and N-doped carbon matrix.
2. Experimental Procedures
2.1 Materials and methods
2.1.1 Materials
Silicon powder, crystalline (Alfa Aesar, ≤ 50 nm), citric acid (ACS reagent, ≥ 99.5%), gelatin (Sigma-Aldrich), melamine (99% Sigma-Aldrich), TIMCAL Graphite & Carbon black (Super-P®) (MTI Korea), 1-methyl-2-pyrrolidinone (NMP, ReagentPlus®, 99%), acetone (Sigma Aldrich, ≥ 99.5%), polyamide-imide (PAI) (Torlon®) were purchased and used without further purification.
2.1.2 Preparation for surface modification of the Si NPs
Surface modification of Si NPs was carried out using citric acid in an NMP solution, following previously reported methods [33]. Firstly, 20% of citric acid was dissolved in the NMP solution and stirred for 30 m. Then 500 mg of Si NP was added to the solution and sonication carried out for 1 h to form a uniform mixture. Then the mixture was stirred for 6 h, and every 30 min the sample was sonicated to avoid particle aggregation, a total of five times. Later, the Si NPs were separated by centrifugation and washed several times with NMP followed by acetone to remove unreacted citric acid and residual NMP, respectively. The samples were airdried and transferred to a vacuum oven at 40 °C for 12 h. The same procedure was repeated to complete surface modification of the Si NPs, which were subsequently named MSi. A simplified diagram of the surface modification process of the Si NPs is shown in Fig 1(a).
2.1.3 Preparation of N-doped carbon-coated Si NPs
The step-by-step preparation process of the N-doped carbon-coated Si NPs is shown in Fig 1(b). As shown in Fig 1(b), 200 mg of gelatin and 400 mg of melamine were dissolved in 30 ml of distilled water at 50 °C by magnetic stirring to make a uniform solution. Then 400 mg of MSi particles were added to the solution, and magnetic stirring continued for 1 h. Then the jelly-like mixture was carefully transferred to an alumina crucible. The crucible was placed in a tubular furnace and carbonized at 800 °C for 2 h in an argon atmosphere at a heating rate of 5 °C per minute. After the furnace was allowed to reach room temperature, the product, named SiNGC, was collected and used for further analysis.
2.2 Chemical Analysis and Characterization Techniques
The crystallographic structure of the prepared material was determined by X-ray diffraction (XRD), in the range of 10° < 2θ <80°. Raman spectroscopy was used to analyze the carbon in the prepared composite. The surface composition of the sample was investigated by X-ray photoelectron spectroscopy (XPS). The surface morphologies of the materials were surveyed by scanning electron microscopy (SEM) and transmission electron microscopy (TEM). Thermogravimetric analysis (TGA) data were recorded at 50-800 °C, with a 10 °C min-1 heating rate, under air atmosphere.
2.3 Electrochemical Analysis
All the electrochemical measurements were evaluated using 2032R button-type coin cells. The working electrodes were prepared with 70 wt% of the prepared electrode material and 20 wt% super P carbon as a conductive additive and 10 wt% polyamide-imide in N-methyl pyrrolidone (NMP) as a binder. All of the added components were well mixed using a mini-mill for 30 min to make a homogeneous slurry. The resulting slurry was uniformly cast on a copper foil using the traditional doctor blade method. The electrode was dried at 80 °C for two hours to evaporate NMP. The dry electrode was placed in a vacuum oven and treated at 200 °C for 3 h to activate the binder. A bare Si nanoparticles (Si NPs) electrode was separately prepared under the same conditions to compare with the SiNGC composite electrode. All of the prepared electrodes were punched with a diameter of 14 mm. The calculated mass loading of the active material on the copper foil was ~1.2 mg cm-2. All cells were fabricated in a glove box filled with argon gas, using metallic Li as the counter electrode, polypropylene membrane as the separator, and standard 1 M LiPF6 in ethylene carbonate, diethyl carbonate, and fluoroethylene carbonate with a v/v ratio of 5:70:25 as an electrolyte.
All cells were examined in the voltage range of 0.01 V-2.0 V vs. Li/Li+ at an applied current density of 200 mA g-1. The rate capability tests were performed with a wide range of current densities (100-3200 mA g-1). The redox behavior was analyzed using cyclic voltammetry (CV) in the same voltage range at a 0.1 mV s-1 scan rate. Electrochemical impedance spectroscopy (EIS) studies were performed in the frequency range of 10 mHz –10 kHz and the amplitude was 5 mA to evaluate reaction kinetics of the composite material. The specific capacities of all cells were calculated based on the active material’s weight.
3. Results and Discussion
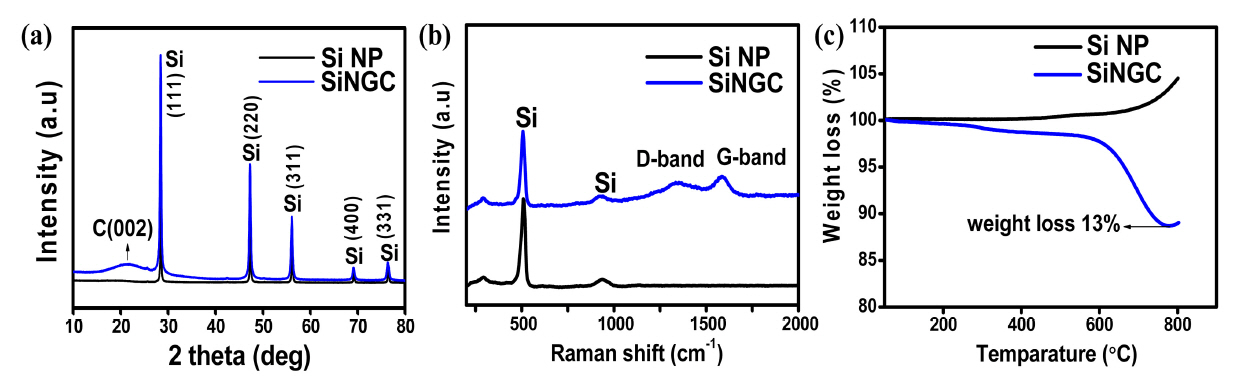
Fig 2(a) shows the measured XRD patterns of the prepared Si NP and SiNGC electrode materials. Prominent diffraction peaks of the SiNGC composite appeared at 2θ = 28.4°, 47.4°, 56.2°, 69.2° and 79.5° (JCPDS#27-1402), corresponding to the (111), (220), (311), (400), and (331) lattice planes of crystalline Si, resulting from the well retained crystalline nature of the Si in the composite after high-temperature heat treatment. The broad peak between 2θ = 20° to 25° corresponds to the characteristic peaks of amorphous carbon derived from the carbonization of the gelatin/melamine and the SiOx layer. SiOx can form during the carbonization process because of the highly reactive surface of the Si NPs [20,34].
The carbon content in the prepared SiNGC composite was analyzed by Raman spectra within the range of 200-1200 cm-1 at room temperature, and the resulting plot was compared with the spectra of pristine Si NPs, and depicted in Fig 2(b). From the figure, both samples exhibited characteristic peaks of Si at 508 cm-1 and 927 cm-1, resulting from the crystal structure of the Si. The two broad peaks that appeared at 1344 cm-1 and 1588 cm-1 in the SiNGC correspond to the D-band and G-band, resulting from structural defects and graphitic carbon respectively, indicating the successful formation of carbon from gelatin [35]. The characteristics of the carbon formed in the sample can be determined by the intensity ratio of the D and G bands (ID/IG). From the data, the calculated ratio of ID/IG was 0.954, demonstrating that the gelatin-derived carbon has good graphitic characteristics, providing excellent electric conductivity and required buffer volume to the Si during the Li+ reactions. The increased conductivity in the composite material can also have a positive effect on the Li+ kinetics in the electrode material, and eventually deliver improved electrochemical properties.
The amount of carbon in the prepared composite material was analyzed using TGA from 50 °C to 800 °C at a heating rate of 10 °C min-1 in an air atmosphere, and the resulting plot is displayed in Fig 2(c). For the bare Si NPs, above 500 °C, a steady increase in weight was observed, indicating the formation SiOx due to the partial oxidation of the Si NPs [34]. The calculated weight loss of the prepared SiNGC composite was 13%. This weight loss can be attributed to the oxidation of carbon in the air atmosphere.
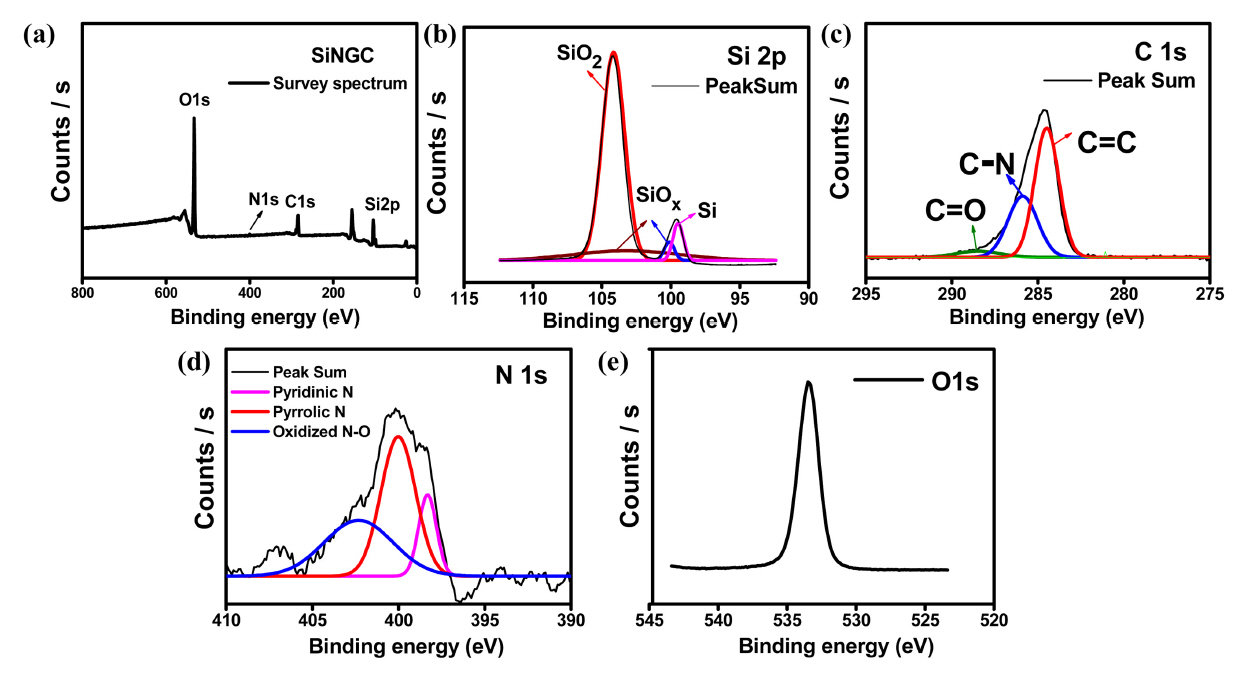
The surface chemical composition of the sample was investigated with XPS, and the results are shown in Fig 3. The wide survey scan spectrum is displayed in Fig 3(a), indicating that the composite material is a combination of Si, C, N, and O [36]. The curve fitting approach was used to distinguish the chemical states of Si, C, and N. The highresolution Si 2p spectra are depicted in Fig 3(b). The figure shows that the peaks at binding energies of 99.4 eV and 104 eV correspond to the Si and SiO2, respectively. The peaks from 99-104 eV are related to the SiOx (1< x <2) layer, indicating the formation of SiOx due to the partial surface oxidation of the Si particles [34]. The high-resolution spectra of the C1s can be fitted into three peaks, which are shown in Fig 3(c). The peak at a binding energy at 284.4 eV is related to C=C, and the peaks at 285.8 eV and 288.2 eV correspond to C–N and C=O, respectively [37].
In Fig 3(d), the high-resolution N1s spectra is fitted into three peaks at binding energies of 398.2 eV, 400 eV, and 401.8 eV, attributed to pyridinic-N, pyrrolic-N, and oxidized-N, respectively [38]. The existence of N in the composite indicates N was successfully doped into the carbon, which can significantly increase the conductivity of the composite SiNGC and improve the electrochemical performance of the electrode material. In Fig 3(e) the peak at a binding energy at 533 eV corresponds to oxygen from the SiOx oxidation layer.
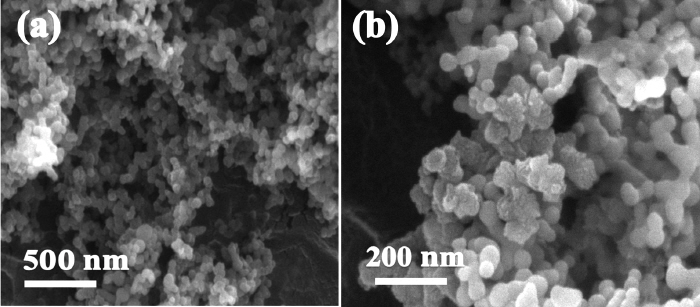
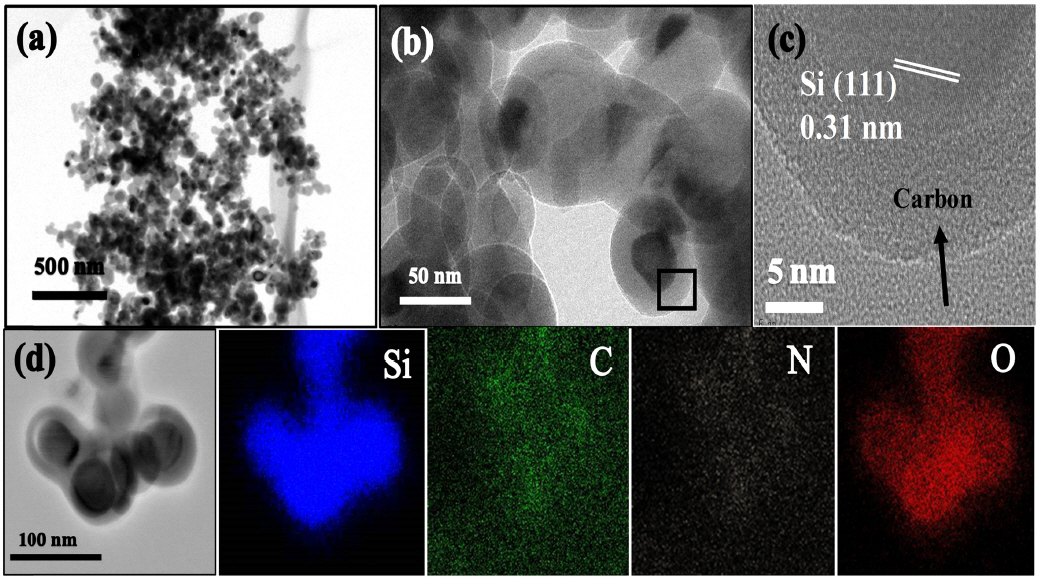
SEM and TEM were employed to determine the surface morphologies of the prepared composite material. The SEM images of the SiNGC sample are shown in Fig. (4). From the images in Fig 4(a) and Fig 4(b), it is evident that the Si NPs have an aggregated morphology. TEM images of the SiGNC composite at different magnifications are shown in Fig 5. From Fig 5(a) and (b), it is clear that the Si NPs are embedded in the carbon matrix, and that most of the Si NPs are coated with carbon.
The high-resolution TEM (HR-TEM) image of the carbon-coated Si NP from Fig 5(b) (black box) is shown in Fig 5(c), and it exhibits a crystalline characteristic, with 0.31 nm d-spacing corresponding to the Si (111) plane. The carbon-coated outer layer is indicated by the black arrow. Fig 5(d) depicts the energy-dispersive X-ray elemental studies (EDX) of the SiNGC composite material, corresponding to Si, C, N, and O, respectively. From the EDX results, it is evident that the Si NPs are surrounded by an N-doped carbon matrix. All of these findings are in good agreement with the XRD and Raman spectra results.
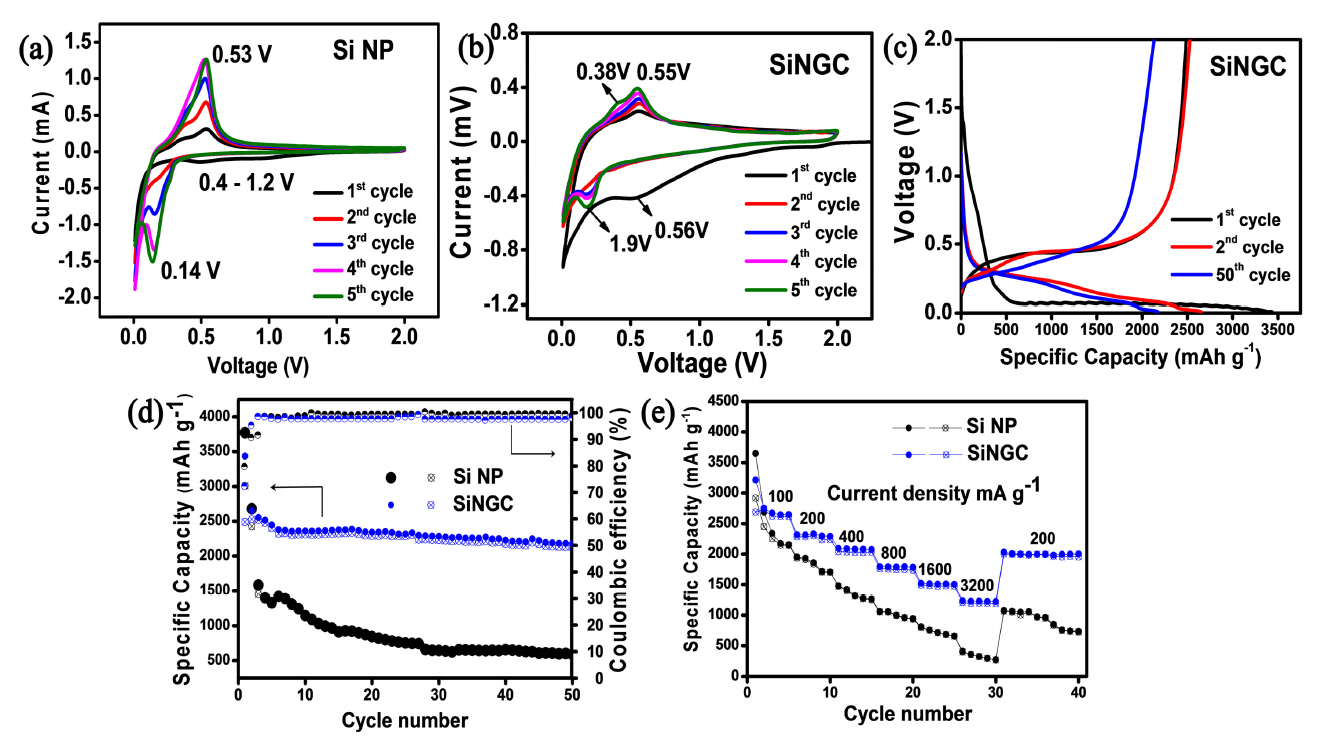
Several electrochemical tests were carried to evaluate the performance of the prepared SINGC composite electrode as an anode material for LIBs. CV was performed to analyze the redox behavior of the prepared electrodes, the bare Si NPs, and the SiNGC electrodes at 0.1 mV s-1 between 0.01 V-2.0 V, and the resulting voltage vs. current plots for the first five cycles are displayed in Fig 6(a) and 6(b) respectively.
For the bare Si NPs, the first cathodic scan shows a broad peak from 1.2 V-0.4 V, resulting from the decomposition reaction of the electrolyte and the formation of the SEI layer. In the SiNGC electrode, the typical broad peak appeared at around ~0.56 V, representing the large SEI formation. The possible reason could be the availability of a large surface area of the prepared electrode material in the N-doped carbon matrix. A large electrolyte/electrode interfacial area can encourage the electrolyte decomposition reaction and lead to larger SEI formation. These broad peaks disappeared in the following cycles for both electrodes, indicating stable SEI formation. The peaks at 0.14 V, 0.05 V vs. Li+/Li for Si NPs, and 0.19 V and 0.05 V vs. Li+/Li for the SiNGC electrodes represent the alloying reaction of Li+ into the active material and the formation of a metastable amorphous LixSi phase [20].
In an anodic scan, the peaks at 0.38 V and 0.55 V vs. Li+/Li in SiNGC are correlated to the two-step dealloying reaction of Li+ from the LixSi phase and the formation of amorphous Si. On the other hand, only one peak at 0.53 V vs. Li+/Li appeared for the Si NPs, indicating a slow and sluggish dealloying process.
Compared with the Si NPs, the overall CV profile of the SiNGC was little changed, and the peak intensities decreased, which could be due to the presence of the carbon matrix. For both electrodes, the peak intensities gradually increased with the number of cycles, indicating the activation process of the active materials, a characteristic phenomenon observed in Si-based anode materials [19-21]. The voltage vs. specific capacity plots of the SiNGC electrode for the 1st, 2nd, and 50th cycles at an applied current density 200 mA g-1 are depicted in Fig 6(c). As shown in the plots, the long discharge plateaus between 0.2 V-0.01 V correspond to the characteristic alloying process of Li+-ions into Si particles, and the formation of the LixSi phase. During charging, the voltage plateaus between 0.2 V-0.62 V correspond to the dealloying process of Li+ ions from Si and indicate the formation of amorphous Si. After the first cycle, the discharge plateaus shifted to 0.25 V due to the typical transformation of crystalline Si into amorphous Si [39].
The cycling performance of the prepared SiNGC composite was evaluated at an applied current density of 200 mA g-1 for 50 cycles and compared with the performance of the bare Si NPs. The resulting specific capacity vs. cycle number plots is shown in Fig 6(d). In the first cycle, the Si NPs exhibited specific capacities of 3772/3010 mAh g-1 with 79% of initial coulombic efficiency (ICE). The irreversible capacity loss of 762 mAh g-1 can be attributed to the formation of the SEI layer on the electrode’s surface. After 50 cycles, the electrode reached 586/579 mAh g-1 specific capacities with 99% CE. The rapid capacity loss in the Si NPs is related to the large volume changes in the active material with the Li+ reactions, which causes the active material to lose contact with the current collector.
On the other hand, the prepared SiNGC electrode showed initial capacities of 3434/2488 mAh g-1 with an ICE of 72% with 946 mAh g-1 irreversible capacity loss. The lower CE/more irreversible capacity loss in the SiNGC electrode is caused by the formation of a larger SEI layer (see Fig 6(b)), which consumes a large amount of Li+ ions due to the large surface reaction area afforded by the N-doped carbon matrix [40]. At the 2nd cycle, the composite electrode exhibited a coulombic efficiency of 95% with specific capacities of 2651/2528 mAh g-1. This greater enhancement in coulombic efficiency indicates the formation of a stable SEI layer. After the 50th cycle, the SiNGC electrode delivered 2175/2132 mAh g-1 specific capacities with 85.7% capacity retention and 98% of coulombic efficiency, which is excellent reversibility. This performance can be attributed to the highly conductive, structurally stable N-doped gelatin-derived carbon matrix in the composite material.
Rate performance tests were carried out for the Si NPs and the SiNGC electrodes at applied current densities from 100-3200 mA g-1 and then compared with those for the bare Si NPs. The resulting rate performance plots are displayed in Fig 6(e). The results show that the SiNGC electrode exhibited superior rate capability compared with the bare Si NPs. The SiNGC electrode delivered 3215, 2316,2093, 1795, 1523 and 1236 mAh g-1 capacities at applied currents of 100, 200, 400, 800, 1600, 3200 mA g-1, respectively. After applying a high current density of 3200 mAg-1, the composite electrode retained the capacity of 2032 mAh g-1 at 200 mA g-1, which is fivefold greater than the commercial graphite anode.
But, the Si NPs electrode delivered 410 mAh g-1 capacity, much less than that of the SiNGC electrode. The rate capability results demonstrate that the excellent conductivity, structural stability, and buffer volume afforded by the N-doped carbon matrix derived from the gelatin/melamine combination played a key role in suppressing the Si anode's drawbacks, even at high applied current densities [20,21].
To investigate the Li+ kinetic properties of the prepared electrodes, EIS was employed in the frequency range of 10 mHz -10 kHz, with a 5 mA amplitude. After 10 cycles at 500 mA g-1 current density, EIS was measured, and the resultant plots are shown in Fig 7(a). As shown in the figure, both electrodes exhibited a depressed semicircle from the high to the middle-frequency region, associated with charge transfer resistance at the electrode/electrolyte interface. An inclined straight line in the low-frequency region was assigned to the Li+ diffusion kinetics [41,42]. From Fig 7(a), the diameter of the semicircle for SiNGC is much smaller than that of the Si NPs, indicating lower charge transfer impedance and electron resistance. The SiNGC electrode exhibit solution resistance (Rs) was 3.69 Ω and the charge transfer resistance (Rct) was 33.6 Ω, while the base Si Nps exhibited an Rs of 5.97 Ω and Rct of 73.3 Ω. These results demonstrate that the coated N-carbon matrix successfully provided the required ionic and ionic channels for faster Li+ kinetics during the Li+ insertion/extraction processes, and improved the diffusion properties. The ZRe vs. ω-1/2 plots of both the Si NPs and SiNGC composite electrodes are shown in Fig 7(b), where ZRe linearly depends on ω-1/2 in the low-frequency region. The following equations were used to evaluate the Li+ diffusion coefficient (D).
Here, R is the gas constant, T is the absolute temperature, C is the Li+ ion molar concentration, A is the electrode area, and F is the Faraday constant. The Warburg impedance coefficient (σw) can be calculated from the slope of ZRe vs. ω-1/2 plots. The calculated Warburg factors for the Si NPs and SiNGC composite were 17.7 Ω s-1/2 and 10.6 Ω s-1/2, respectively.
As shown in equation (2), the Li+ diffusion coefficient is inversely proportional to σw, so that the lower σw gives a higher diffusion coefficient and favors higher energy densities. The calculated D for the Si NPs and SiNGC electrodes was 9.64 × 10⁻¹² cm2 s−1 and 2.69 × 10⁻¹¹ cm2 s−1, respectively. The higher D value indicated faster kinetics in the cell reactions in the SiNGC electrode, due to high conductivity and shorter Li+ and electron transporting lengths, resulting from the N-doped carbon matrix.
Finally, the surface-modified Si NPs provide a successful platform for a firm, uniform coating of the N-doped carbon matrix derived from an eco-friendly gelatin/melamine combo. The synergetic effect of the high capacity Si anode and highly conductive and flexible N-doped carbon matrix significantly improves electrochemical properties, delivers highly stable cycle life, and is advantageous for the low-cost preparation of high energy anode materials for practical LIB applications. We have compared the applied current density, specific capacity, and capacity retention percentages of different Si/carbon composites and summarized them in Table 1.
4. Conclusion
In summary, we prepared Si nanoparticles firmly coated with a nitrogen-doped carbon matrix using a simple two-step approach. Surface modification with citric acid creates an active surface on the Si NPs, which allowed the particles to bond to the gelatin/melamine combination. A subsequent high-temperature heat treatment resulted in Si particles uniformly coated with an N-doped carbon matrix. When studied as an anode material for Li-ion batteries, the composite delivered excellent electrochemical properties, which can be credited to the collective effect of high-capacity Si nanoparticles with highly conductive and structurally stable carbon matrices. The N-doping also improved the conductivity of the composite and provided more ionic channels for Li+ diffusion. After 50 cycles, the composite delivered 2175 mAh g-1 capacity with 86% capacity retention. Along with superior rate capability, the composite exhibited better diffusion properties compared with pristine Si particles. This study provides insight into cost-effective and eco-friendly carbon sources for carbon coatings/composite for Si-based anode materials suitable for largescale production for Li+ energy storage applications.