


1. Introduction
Lead-based piezoelectric materials have been intensively investigated for their excellent piezoelectric (pC/N) and inverse piezoelectric (pm/V) properties. As a representative piezoelectric material, (Pb,Zr)TiO3 has been extensively employed in industrial applications due to its excellent piezoelectric and mechanical properties (d33 ~ 360 pC/N, kp ~ 0.51) with high Curie temperature (> 300 °C) [1-3]. Accordingly, this material has been tested for various applications including actuators, sensors and transducers, which can be used in conditions of heavy load and mechanical force. Despite these excellent mechanical and piezoelectric properties, lead based piezoelectric materials also present environmental issues due to the toxic and harmful properties of lead. To avoid these environmental problems, lead free alternatives to replace lead-based piezoelectric materials have been widely and intensively investigated. Among them Bi0.5Na0.5TiO3 (BNT), Na0.5K0.5NbO3 (NKN) and BaTiO3 (BT) are representative leadfree piezoelectric materials. NKN has a high piezoelectric charge coefficient of 160 pC/N with a high Curie temperature of 420 °C [4,23]. But NKN has the drawback of being highly volatile because of the low melting temperatures of Na and K [5]. Another alternative lead-free piezoelectric material candidate, BNT, has a very high piezoelectric charge coefficient 230.8 pC/N, a relatively larger electromechanical coupling factor (kp ~ 0.41), larger remanent polarization (Pr ~ 40 µC/cm2) and a better P–E hysteresis loop at relatively high temperature then other lead-free piezoelectric ceramics [6-7]. However, its open stress vs strain curve means applied energy can accumulate, resulting in high fatigue and lower reliability [8]. BT has shown promising properties, including a high piezoelectric charge coefficient of more than 460 pC/N [9-10]. Therefore, in this research, a substitution type of BT material was selected to investigate the relationship between activation energy and piezoelectric properties.
Piezoelectric ceramics have typically been fabricated with high density to achieve a high d33 and reliable mechanical stability. In this paper, the activation energy of BZT-BCT was derived from its shrinking behavior during the sintering process, and the sintering temperature and BCT contents (0.4 ≤ x ≤ 0.5) were optimized. The Arrhenius equation was adopted to derive activation energy from shrinking behavior. (1-x)Ba(Zr0.2Ti0.8)O3-x(Ba0.7Ca0.3)TiO3 has been intensively investigated for application in sensors and energy harvester because of its high piezoelectric performance and properties [19-20]. A high piezoelectric charge coefficient d33 of 620 pC/N has been reported, and (1-x)Ba(Zr0.2Ti0.8)O3–x(Ba0.7Ca0.3)TiO3 (hereafter BZT-BCT) piezoelectric ceramics have been investigated to replace PZT lead based piezoelectric materials [15]. One important feature of BZT-BCT is that the R-T phase transition is expected to occur between BCT contents of 0.4 ≤ x ≤ 0.5. It is known that the phase transition leads to high piezoelectric performance in materials such as PZT and PMN-PT [15,18,19,22].
In this study, we have focused on (1-x)BZT–xBCT materials with x(Ba0.7Ca0.3)TiO3 contents of x = 0.4, 0.425, 0.45, 0.475, 0.5 and sintering temperatures of 1475 °C, 1500 °C, and 1525 °C. This study has focused on the shrinkage mechanism and activation energy of BZT-BCT ceramics to explain its outstanding piezoelectric properties. The densification behavior of BZT-BCT and its microscopic surface were also measured.
2. Experimental
2.1 Fabrication process of (1-x)BZT-xBCT
First, stoichiometric mixtures of (1-x)BZT–xBCT (x = 0.4, 0.425, 0.45, 0.475, 0.5) ceramic were sintered by conventional solid state sintering process. Powders of BaCO3(purity 99.9%, Sigma-Aldrich Co., Ltd.), TiO2(purity 99.9%, Kojundo), ZrO2(purity 99.0%, Sigma-Aldrich Co. Ltd.), and CaCO3 (purity 99.0%, Sigma-Aldrich Co., Ltd.), were mixed with ethyl alcohol and ball milled for 24h. After the drying process, powders of the (1-x)BZT-xBCT ceramics were calcined at 1350 °C for 2h. The calcination process is essential to eliminate un-desirable substances such as carbides. After the calcination process, partly aggregated powders were smashed and re-powdered again to enhance their crystallization during the sintering process. Sintering can be used to improve crystalline structure. Although these calcination and sintering processes have different purposes, portions of their processing temperature range overlap. However, if the calcined powders are re-powdered before the sintering process, the calcination will not significantly affect the sintering process. This indicates the calcination process does not affect the activation energy induced by shrinking behavior.
Green bodies were pressed into disks under 3 metric tons (12 mm in diameter and 1.6mm in thickness). To investigate the shrinkage mechanism of (1-x)BZT-xBCT ceramics, specimens were sintered at various temperatures ranging from 800 °C - 1525 °C, with a holding time of 3 h and a heating rate and cooling rate of 3 °C/min [16-17]. The relative shrink ratios of the (1-x)BZT-xBCT samples were measured by hydrometer, and then the samples were thermally etched for 10 min to investigate their surface morphologies using field emission scanning electron micrography. The crystalline structure of each specimen was investigated using X-ray diffraction (D8-Advance/BrukerAXS) analysis. The relative dielectric constant (εr) was measured by impedance analyzer (Agilent 4294A). The relative density was measured using the Archimedes method. The volume was calculated as the product of the area and thickness of the fabricated sample. Thorough shrinkage tests of each of these samples were conducted at various sintering temperatures.
2.2 Mathematical method; Arrhenius equation
Firstly, the kinetic equation was plotted, which is the relative shrinkage ratio with exponent n versus the reciprocal of T to derive the relation between shrinkage ratio and activation energy in equation (1), where L is the volume after the sintering process, and L0 is the volume before the sintering process. K is the rate constant and T is the absolute temperature.
Then Eq. (2) is replotted to get exponent n. In this replotted equation, t is the holding time of the sintering process.
Eq. (3) can be derived from Eq. (1) in Arrhenius equation form by differentiation with respect to T, where a is the heating rate.
K can be rearranged by the relationship between activation enegy Q, gas constant R (R = 8.314 J/Kmol).
By re-arranging Equation (1), Equation (3) and Equation (4), Equation (5) can be derived
3. Results and Discussion
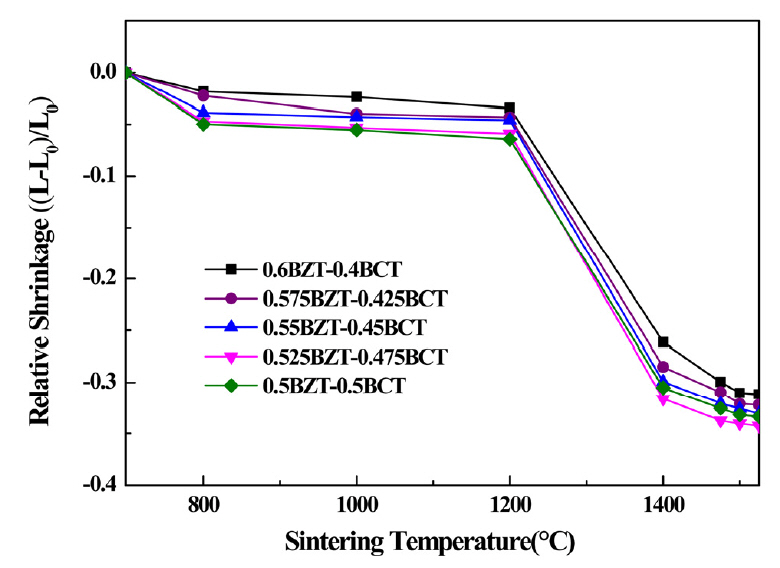
Figure 1 shows the relative shrinkage ratio of the (1-x) BZT–xBCT ceramics sintered at temperatures from 800 °C to 1525 °C. As shown in the figure, the porosity of the ceramic can be decreased during the sintering process without melting. After the sintering process, the relative shrinkage ratios of the (1-x)BZT–xBCT ceramics were measured. As shown in Figure 1, the (1-x)BZT–xBCT ceramics started to shrink at 1200 °C. The BCT sample with a content of 0.5 showed the highest shrinkage ratio in the temperature range of 800 °C -1200 °C, and the sample with the BCT content of 0.475 showed the highest shrinkage ratio in the temperature range of 1200 °C - 1525 °C. The sintering process of the (1- x)BZT–xBCT ceramics was completed near 1500 °C. The shrinkage rate of (1-x)BZT–xBCT was around 31.1% - 34.2 % at a sintering temperature of 1500 °C.
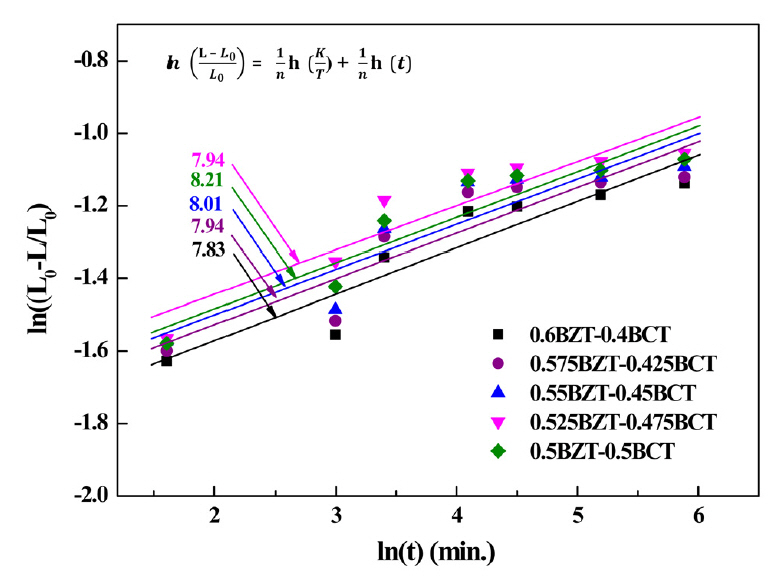
Figure 2 shows the isothermal shrinkage curves of the (1-x) BZT–xBCT ceramics depending on holding time. Different holding times were analyzed using the kinetic equation [12-13]. Also, different sintering time depending on the sintering temperature was investigated.
Eq. (2) was employed to plot the I n ( L - L 0 L 0 )
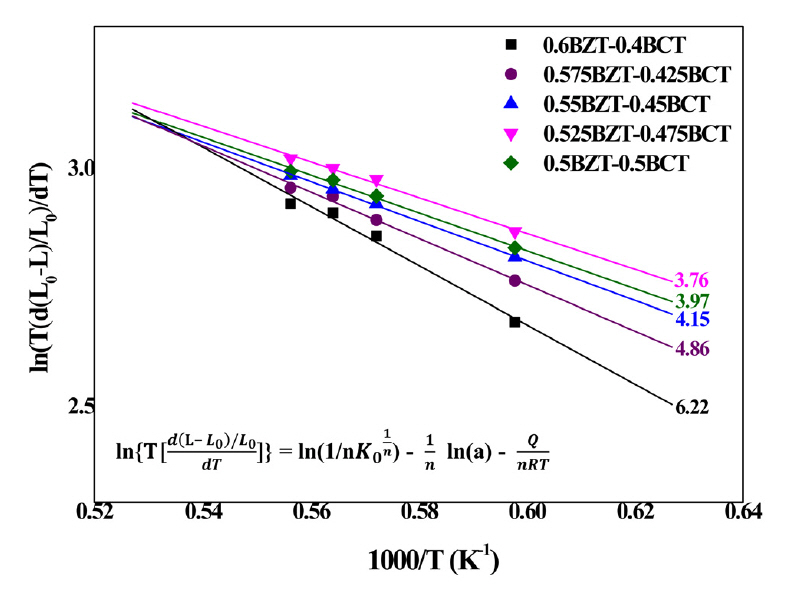
Figure 3 shows the activation energy of the (1-x)BZT–xBCT ceramics, simulated using the temperature dependent shrinkage rate from Figure 1. Figure 3 shows the reconstructed curves for the relative shrinkage ratio of (1-x)BZT–xBCT samples sintered at 1400 to 1525 °C which is translated to Arrhenius equation form. Inverse temperature versus shrinkage rate gives the activation energy from the slope in Figure 1. Since the calcination process was carried out at 1350 °C, lower than the 1300 °C sintering temperature, the shrinkage ratio was not considered in calculating the shrinkage mechanism. As a result, from the slope (Q / nRT) of the ln T[ d ( L - L 0 ) / L 0 d T ]
The calculated activation energies Q in the temperature range 1400 - 1525 °C were around 404.9, 320.8, 276.3, 248.2 and 270.9 kJ/mol, respectively.
Table 1 lists the exponents of n and activation energies Q of the (1-x)BZT–xBCT ceramics. The lowest n value was 7.83 for the 0.6BZT–0.4BCT ceramic. The activation energy of the specimens means the internal energy needed to grow grains during the sintering process. Therefore, the lowest activation energy leads to the most easily sintered sample, compared with other specimens [12-14].
Figure 4 shows the X-ray diffraction θ-2θ patterns of the (1-x)BZT–xBCT ceramics sintered at 1500 °C., to investigate their crystalline properties The patterns indicate that all the specimens are single-phase. Samples with BCT contents of 0.4 ≤ x ≤ 0.45 exhibited a rhombohedral structure. As shown in the figure, the split peak of (002)/(200) at BCT contents (x) of 0.475 ≤ x ≤ 0.5 indicate a tetragonal structure, which is the phase transition region between the rhombohedral phase and tetragonal phase [19]. Therefore, x approaching x = 0.45 (1-x)BZT–xBCT ceramics have a mixed phase of rhombohedral and tetragonal structures.
Moreover, the Bragg reflections of the (002)/(200) planes showed that the position of the (002) peak shifted to a slightly lower angle when the BCT content was increased from 0.4 to 0.475, then shifted to a higher angle at a BCT content of 0.5. The (002) peak shift to a lower angle means that the volume of the (1-x)BZT–xBCT ceramics increased, since the two different rhombohedral and tetragonal phases are mixed near x = 0.45. But when the BCT contents were increased further to x = 0.475, the (002)/(200) planes moved to a higher position. This means the volume of the (1-x)BZT–xBCT ceramics decreased. The atomic radius of Ba and Zr are sligthly larger than those of the Ca and Ti atoms. As the x composition increased, Ba and Zr content decreased, while Ca and Ti were increased. This has the effect of decreasing the volume of the (1-x)BZT–xBCT structure. The atomic radius of Ba, Zr, Ca, Ti are 1.43, 1.06, 0.87, and 0.64 Å, respectively.
The position of the (002) peak at 45.02o relative to that that the lattice constant c of the 0.525 BZT–0.475BCT implies it has increased relative to that of the other specimens. In fact, the 0.525 BZT–0.475BCT had the highest c lattice parameter among all specimens.
Figure 5 shows the enlarged X-ray diffraction pattern in the range of 43 to 46.5, where the (002) and (200) planes exist. The symetric shape near 2θ = 45o, for BCT contents of 0.4 ≤ x ≤ 0.45, indicate a single rhombohedral structure, while the split peak of (002)/(200) planes indicate that BCT contents of 0.475, 0.5 have a rhombohedral with tetragonal structure. This represents a peak shift of (002) in the (1-x)BZT–xBCT ceramics. As shown in the figure, 0.525BZT–0.475BCT show a split peak for the (002) and (200) planes, indicating increased tetragonality. When the composition of x = 0.425, 0.45, and 0.475, the peak positions were very similar. However, when the BCT contents were 0.5, then the (002) peak was shifted to a higher angle as the composition of the BCT was increased. In the tetragonal structure, increased (002) peaks means that Ba, Zr, which have larger ionic radii compared to Ca, Ti, decreased as the BCT contents increased, reducing the lattice parameter according to Bragg’s law. Also, when x = 0.4, 0.425, the rhombohedral structure peak was shifted to a lower angle. According to the crystal geometry equation, α approaches 90 degrees, and an increase in the unit cell volume can be seen.
Figure 6 shows the relative densities of the (1-x)BZT–xBCT samples sintered at 1475 °C, 1500 °C, 1525 °C. All sintering temperature showed that relative density increased up to BCT contents of about x = 0.475 with 94.4%, and then decreased. This density increase likely indicates the optimum BCT content and sintering temperature. In addition, this bulk density is probably related to the degree of crystalization in the (1-x)BZT–xBCT ceramics. Because the crystalization process is related to the BCT contents and sintering temperature, the relative density is also related to BCT contents.
As the sintering temperature was increased from 1475 to 1500 °C, the crystalization process progressed due to its low activation energy, as discussed in Figure 3. However, when the sintering temperature was further increased above 1500 °C, the volume increased and weight might be decreased due to the low evaporation temperature of Ca, at 1484 °C. The BZT-BCT material exhibited tricritical points in the phase diagram, and near the tricritical points the x = 0.475 phase can be drastically changed. With increasing BCT content, the BZT-BCT material forms rhombohedral, orthorombic, and tetragonal structures. Due to this phase transition, relative density increased up to the tricritical points at x = 0.475. However, relative density can be decreased due to the phase transition with mixed phase [16].
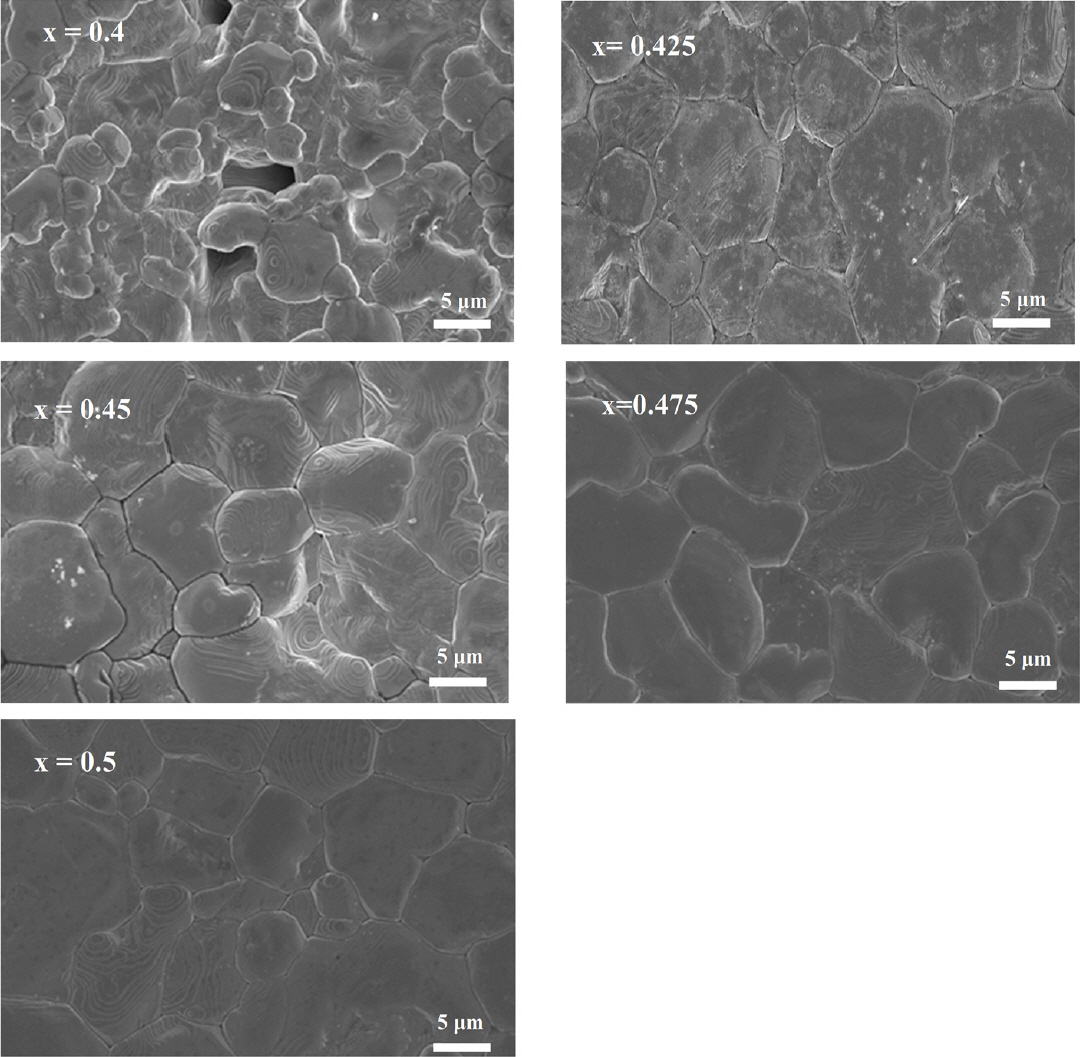
Figure 7 shows Field emission scanning electron microscopy micrographs of the thermally etched (1-x)BZT–xBCT ceramics sintered at 1500 °C. The (1-x)BZT–xBCT ceramic has an average grain size of 9.5-11 μm. As shown in Fig 7(a), 0.6BZT–0.4BCT has a porous morphological surface, explaining the lower piezoelectric charge coefficient. With increasing BCT content, the grain size becomes larger with a clearer grain boundary, supporting the data in Figure 6, showing the bulk density of the (1-x)BZT–xBCT ceramics. For 0.525BZT–0.475BCT the minimum activation energy needed to grow grains was assumed to be 201.88 kJ/mol, in the temperature range of 1200 °C - 1525 °C, resulting in a dense, coarse-grain microstructure, while 0.6BZT–0.4BCT needed the highest activation energy, 561.6468 kJ/mol, at a temperature range of 1200 °C - 1525 °C, producing a fine, porous-grain microstructure.
Figure 8 displays the piezoelectric charge coefficients of (1-x)BZT–xBCT samples sintered at 1475 °C, 1500 °C, 1525 °C. As shown in the figure, all of the specimens exhibit an increasing piezoelectric charge coefficient up to 470 pC/N at a BCT content of 0.475, and then decrease. Among other sintering temperatures, the specimens sintered at 1500 °C showed a relatively higher piezoelectric charge constant, indicating that the optimized sintering temperature was 1500 °C from the perspective of energy harvesting.
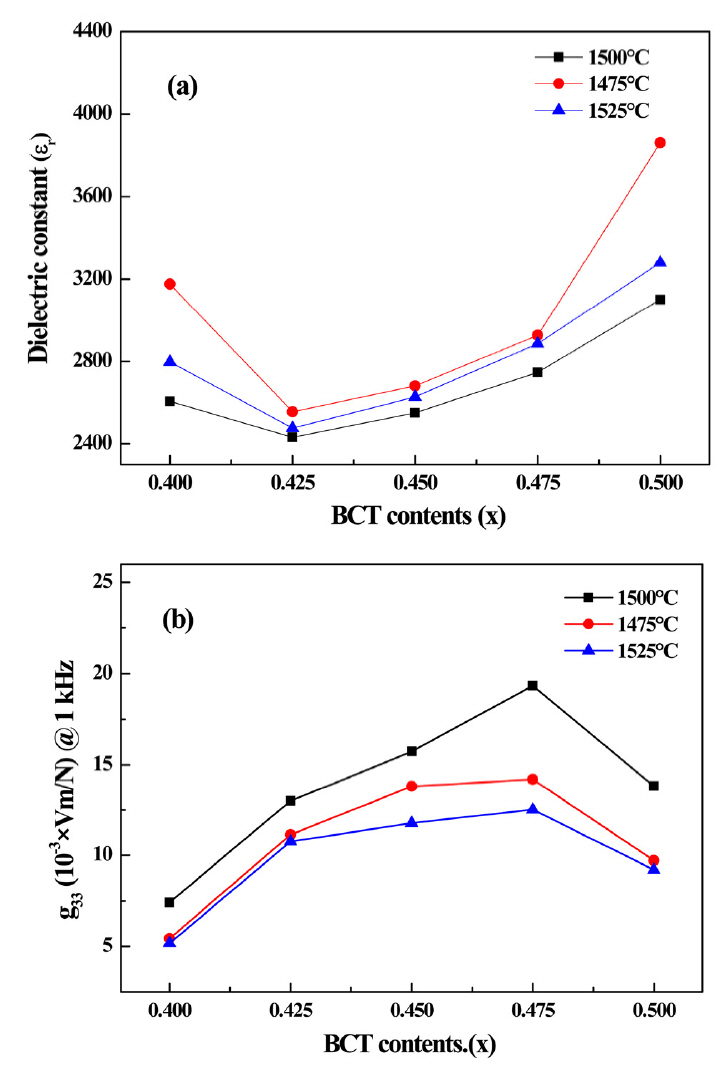
Figure 9(a) displays the dielectric constants of (1-x)BZT–xBCT at 1kHZ (1475 °C, 1500 °C, 1525 °C). At all sintering conditions the samples exhibited the lowest dielectric constant with BCT contents of 0.425, and then increased with increasing BCT contents. The lowest dielectric constant of (1-x)BZT–xBCT was 2431.95 for the sample sintered at 1500 °C. Fig 9(b) displays the piezoelectirc voltage constants of (1-x)BZT–xBCT ceramics at 1 kHz (1475 °C, 1500 °C, 1525 °C). The specimens sintered at a temperature of 1500 °C had a relatively higher piezoelectric charge constant specimens then the other sintering temperatures, and showed the highest piezoelectric voltage constant. Also, the sample with the BCT content of 0.475 had the highest piezoelectric voltage constant under all sintering temperature conditions. The highest value was 19.34 mVm/N at a BCT content of 0.475.
4. Conclusions
In this research, the relationship between shrinking behavior, activation energy and the piezoelectric properties of lead-free piezoelectric (1-x)Ba(Zr0.2Ti0.8)O3–x(Ba0.7Ca0.3) TiO3 ceramics were investigated. There were two shrinkage mechanisms, located in the temperature ranges of 800-1200 °C and 1200 -1525 °C, respectively. Each specimen had a distinct shrinkage mechanism, defined by exponent n. Among the specimens, those with BCT contents of 0.4 had the lowest value of exponent n, 7.83. With increasing BCT contents up to 0.475, the n value and activation energy decreased. 0.55BZT-0.45BCT exhibited the lowest activation energy of 129.86 kJ/mol in the sintering temperature range of 800 °C-1200 °C and 0.525BZT-0.475BCT showed the lowest activation energy of 248.21kJ/mol in the temperature range of 1200 °C-1525 °C. Also, the low BCT content specimens had a fine porous morphological surface, and with increasing BCT contents, the morphological surface became dense with a coarse grain structure. Based on the investigation of the shrinkage mechanism, the sintering temperature and piezoelectric properties were optimized. The (1-x)BZT–xBCT ceramics (x = 0.4. 0.425, 0.45, 0.475, 0.5) sintered at 1500 °C exhibited a relatively high bulk density compared to those sintered at other temperatures. The highest piezoelectric charge coefficient (470 pC/N) and piezoelectric voltage coefficient (19.34 mVm/N) at a frequency of 1 kHz were obtained at the sintering temperature of 1500 °C and BCT content of 0.475.