


1. INTRODUCTION
Recently, in efforts to address renewable energy and environmental issues, thermoelectric energy conversion has attracted considerable attention [1]. Tetrahedrite Cu12Sb4S13 has been studied as a p-type thermoelectric material, consisting of earth-abundant sulfosalt minerals and ecofriendly elements [2-4]. The tetrahedrite is composed of CuIS4 tetrahedra, CuIIS3 triangles, and SbS3 pyramids. It belongs to the space group I4 ¯ Cu 10 I Cu 2 II Sb 4 S 12 I S II
Previous studies have focused on substituting Cu with other transition elements (Zn, Fe, Ni, Mn, etc.); no extensive studies have been reported on the substitution (doping) of the Sb sites. In our previous study, Cu12Sb4-yBiyS13 (y = 0.1ŌĆō0.4) doped with Bi at Sb sites was successfully prepared by mechanical alloying (MA) and hot pressing (HP). The carrier concentration increased with the Bi doping level in the temperature range of 323ŌĆō723 K. The resulting, Cu12Sb3.9Bi0.1S13 exhibited a dimensionless figure of merit ZT = 0.88 at 723 K because of its high power factor and very low thermal conductivity [10]. Bouyrie et al. [11] synthesized a Te-doped Cu12Sb4-yTeyS13 (y = 0.52ŌĆō1.85) using encapsulated melting (EM) and spark plasma sintering (SPS) and obtained a maximum ZT = 0.80 at 623 K for Cu12Sb3.39Te0.61S13 because of its very low thermal conductivity. Lu et al. [12] prepared Cu12Sb4-yTeyS13 (y = 0ŌĆō1) using the EMŌĆōmillingŌĆōHP method and achieved a high ZT of 0.92 at 723 K for Cu12Sb3TeS13.
When tetrahedrite is synthesized by a conventional melting method, because S has a boiling point (717 K) lower than the melting point (1356 K) of Cu, elaborate heating, maintenance, and cooling steps are required. In addition, a long subsequent annealing should be carried out for phase transformation and homogenization [13,14]. However, MA can be used to avoid phase separation and evaporation of elements through a low-temperature solid-state process and can synthesize and homogenize a nanopowder [15]. In this study, Cu12Sb4-yGeyS13 (y = 0.1ŌĆō0.4), partially substituted with Ge at the Sb sites, were synthesized by MA and sintered by HP and their phases and thermoelectric properties were analyzed. By doping Ge at the Sb sites, the optimal carrier concentration was adjusted to change the electrical conductivity and Seebeck coefficient and maximize the power factor. An improved dimensionless figure of merit was expected by maintaining a high power factor and reducing the thermal conductivity, due to carrier and phonon transport variations.
2. EXPERIMENTAL PROCEDURE
Ge-doped tetrahedrites Cu12Sb4-yGeyS13 (y = 0.1, 0.2, 0.3, and 0.4) were synthesized by MA. Cu (<45 ┬Ąm, purity: 99.9%), Sb (<150 ┬Ąm, purity: 99.999%), Ge (<45 ┬Ąm, purity: 99.99%), and S (<75 ┬Ąm, purity: 99.99%) were weighed to obtain the corresponding stoichiometric compositions. Mixed powders and stainless-steel balls were placed in a hardened steel jar. Once the inside of the jar was vacuumed, Ar gas was injected and MA was performed for 24 h at a rotational speed of 350 rpm using a planetary ball mill (Fritsch Pulverisette5). The powder synthesized through MA was charged into a graphite mold and sintered by HP for 2 h at 723 K under 70 MPa in a vacuum atmosphere. The detailed MAŌĆōHP conditions are presented in our previous report [16]. The sintered specimen was cut into disks with dimensions of 1 mm (thickness) ├Ś 10 mm (diameter) to measure the Hall coefficient and thermal conductivity, and cut into a parallelepiped with dimensions of 3 mm (width) ├Ś 3 mm (depth) ├Ś 9 mm (height) to measure the Seebeck coefficient and electrical conductivity.
A phase analysis of the MAŌĆōHP specimens was performed using X-ray diffraction (XRD; Bruker D8-Advance) with Cu K╬▒ radiation. The diffraction pattern was obtained at a scan speed of 0.4 s/step. The crystallinity and lattice constants were estimated by Rietveld refinement (TOPAS). The microstructures of fractured surfaces of the sintered specimens were observed using scanning electron microscopy (SEM; FEI Quanta400) equipped with energydispersive spectrometry (EDS; Bruker Quantax200). For the EDS analysis, elemental energy levels were used, including those of Cu L╬▒ (0.928 eV), Sb L╬▒ (3.604 eV), Ge L╬▒ (1.188 eV), and S K╬▒ (2.309 eV). Through the EDS elemental mapping, the homogeneous distribution of the constituent elements was confirmed. The Hall coefficient was measured by applying a constant magnetic field of 1 T and current of 100 mA using the van der Pauw method (Keithley 7065), and then carrier concentration and mobility were analyzed. The Seebeck coefficient (╬▒) and electrical conductivity (Žā) were measured in a He atmosphere using the temperature differential method and direct-current (DC) four-probe method, respectively (Ulvac-Riko ZEM-3). The thermal diffusivity was measured in vacuum using the laser flash method (Ulvac-Riko TC-9000H), and then the thermal conductivity (╬║) was estimated from the thermal diffusivity, specific heat, and density. Finally, the power factor (PF = ╬▒2Žā) and dimensionless figure of merit (ZT = ╬▒2Žā╬║-1T) were evaluated.
3. RESULTS AND DISCUSSION
Figure 1 shows the results of the XRD analysis of the Ge-doped tetrahedrites Cu12Sb4-yGeyS13 prepared by the MAŌĆōHP process. All diffraction peaks were consistent with the standard diffraction data (International Center for Diffraction Data (ICDD) PDF#024-1318) for tetrahedrite. All specimens contained a single tetrahedrite phase without unreacted residual elements and secondary phases. As shown in Table 1, Rietveld refinement confirmed that the lattice constant decreased from 1.0343 to 1.0334 nm as the Ge content increased, because the ionic radius of Ge4+ (39 pm) is smaller than that of Sb3+ (76 pm). Thus, the lattice constant decreased with the increase in the Ge substitution at the Sb sites [17].
Figure 2 shows SEM images of the fractured surfaces of the sintered Cu12Sb4-yGeyS13. Notably, no remarkable difference in the microstructure was observed according to the Ge content. Densely sintered specimens could be obtained. As shown in Table 1, all of the specimens exhibited high relative densities of 98.5%ŌĆō100.0%. The actual compositions were similar to the nominal compositions. The volatilization of component elements was suppressed due to the solid-state synthesis using MA. The EDS elemental maps for Cu12Sb3.8Ge0.2S13 confirmed that every element was homogeneously distributed.
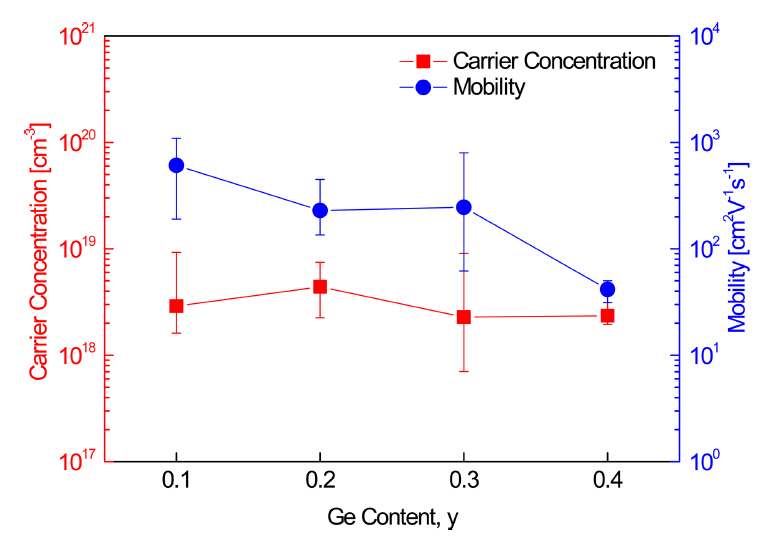
Figure 3 shows the carrier concentration and mobility of Cu12Sb4-yGeyS13. Because of the substitution of Ge4+ at the Sb3+ sites, the carrier concentration was expected to decrease by reducing the number of holes (majority carriers) by the additionally supplied electrons (charge compensation). However, the change in the carrier (hole) concentration with the Ge content was not large, and the mobility decreased as the Ge content increased. When the Hall coefficient was measured 15 times on the same specimen, different values with large errors were obtained. Similar results have been reported [3,18], where very low Hall coefficients close to zero or very different values were obtained in repeated measurements on the same tetrahedrite sample. Therefore, the measured Hall coefficient of tetrahedrite did not have reliable accuracy.
Figure 4 shows the Seebeck coefficient for Cu12Sb4-yGeyS13. Positive Seebeck coefficients were obtained as positive signs of the Hall coefficient, which indicated that the majority carrier was holes, for a p-type semiconductor. When y = 0.1ŌĆō0.3, the Seebeck coefficient increased with the temperature, while, when y = 0.4, the Seebeck coefficient exhibited a negative temperature dependence. In general, the Seebeck coefficient of a p-type semiconductor increases as the temperature increases [19]. However, when the temperature exceeds a certain value, an intrinsic transition occurs, which rapidly increases the carrier concentration, leading to a decrease in the Seebeck coefficient. In other words, as the temperature of the semiconductor increases, the Seebeck coefficient decreases after reaching the highest value at a specific temperature. In this study, the intrinsic transition only occurred in Cu12Sb3.6Ge0.4S13 and did not occur in the other specimens within the measurement temperature range. Thus, the Seebeck coefficient increased with the temperature. However, in the case of Cu12Sb3.6Ge0.4S13, the intrinsic transition seemed to occur at temperatures below 323 K. As a result, the carrier concentration rapidly increased with the temperature, while the Seebeck coefficient decreased.
As the Ge content increased at a constant temperature, the Seebeck coefficient increased. Therefore, the Ge doping reduces the carrier (hole) concentration, which increases the Seebeck coefficient. In this study, Cu12Sb3.6Ge0.4S13 exhibited the highest Seebeck coefficient of 251ŌĆō224 ┬ĄVK-1 at 323ŌĆō723 K, higher than the Seebeck coefficient of 105ŌĆō140 ┬ĄVK-1 for an undoped Cu12Sb4S13 in the temperature range of 300ŌĆō690 K reported by Barbier et al. [4]. Kwak et al. [10] achieved a maximum of 154ŌĆō187 ┬ĄVK-1 at 323ŌĆō723 K for Cu12Sb3.9Bi0.1S13 among Cu12Sb4-yBiyS13 (y = 0.1ŌĆō0.4) specimens. Bouyrie et al. [11] obtained a maximum of 190ŌĆō260 ┬ĄVK-1 at 300ŌĆō700 K for Cu12Sb2.15Te1.85S13 among Cu12Sb4-yTeyS13 (y = 0.52ŌĆō1.85) specimens. Therefore, the Ge doping at Sb sites was very effective at increasing the Seebeck coefficient of tetrahedrite.
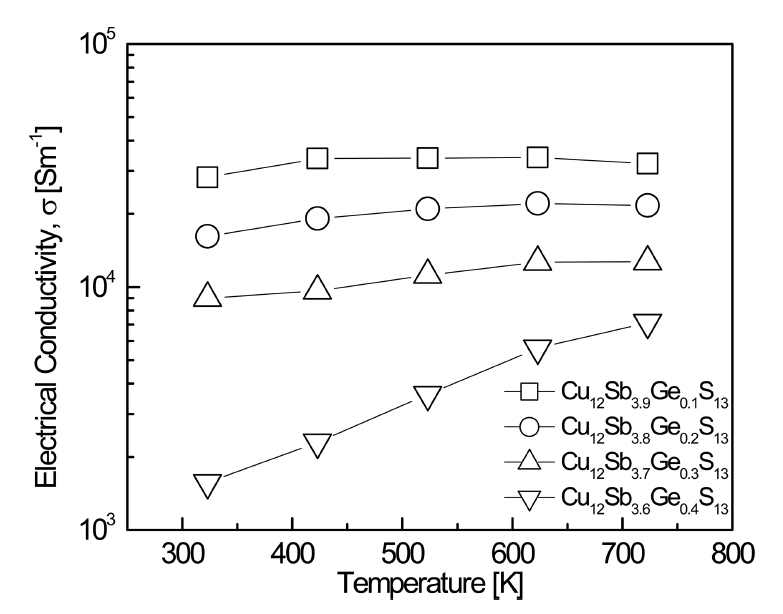
Figure 5 shows the electrical conductivity of Cu12Sb4-yGeyS13. At y = 0.1ŌĆō0.3, the electrical conductivity initially increased with the temperature, and then decreased slightly at temperatures above 623 K. This was expected to transit the conduction mechanism of tetrahedrite from nondegenerate semiconducting to metallic (or degenerate semiconducting). However, for y = 0.4, the nondegenerate semiconductor behavior was maintained in the measured temperature range. At a constant temperature, the electrical conductivity decreased as the Ge content increased, which resulted from the reduced carrier (hole) concentration due to additional electrons with the Ge4+ substitutions at the Sb3+ sites. In this study, Cu12Sb3.9Ge0.1S13 exhibited the highest electrical conductivity of (2.8ŌĆō3.2) ├Ś 104 Sm-1 at 323ŌĆō723 K. Barbier et al. [4] reported an electrical conductivity of (4.3ŌłÆ6.2) ├Ś 104 Sm-1 at 300ŌĆō690 K for the undoped Cu12Sb4S13. Kwak et al. [10] suggested that, as the Bi content of Cu12Sb4-yBiyS13 (y = 0.1ŌĆō0.4) increased, more Cu vacancies acting as acceptors resulted in the carrier concentration increase. As a result, Cu12Sb3.7Bi0.3S13 exhibited the highest electrical conductivity of (3.1ŌłÆ3.6) ├Ś 104 Sm-1 at 323ŌłÆ723 K. However, when the Bi content increased to y = 0.4, the electrical conductivity decreased to (1.5ŌłÆ2.1) ├Ś 104 Sm-1 due to the formation of a secondary phase (skinnerite; Cu3SbS3). Bouyrie et al. [11] reported that Cu12Sb3.48Te0.52S13 among Cu12Sb4-yTeyS13 (y = 0.52ŌĆō1.85) specimens exhibited the highest electrical conductivity of (10.0ŌłÆ6.7) ├Ś 104 Sm-1 at 300ŌĆō700 K.
Figure 6 shows the power factor for Cu12Sb4-yGeyS13. The power factor is expressed by PF = ╬▒2Žā [20]. Because the carrier concentration has opposite effects on these two parameters, the optimal carrier concentration is necessary to obtain the maximum power factor. In this study, the PF increased as the temperature increased, which resulted from the temperature dependence of the Seebeck coefficient (Fig 4) and electrical conductivity (Fig 5). As the Ge content increased at a constant temperature, the PF decreased, because the decrease in the electrical conductivity was more dominant than the increase in the Seebeck coefficient due to Ge doping. Although Cu12Sb3.9Ge0.1S13 had the lowest Seebeck coefficient, due to the influence of its highest electrical conductivity, the highest PF of 0.38ŌĆō0.87 mWm-1K-2 were obtained in the temperature range of 323ŌĆō723 K. Barbier et al. [4] reported a PF of 0.60ŌĆō1.02 mWm-1K-2 at 300ŌĆō700 K for the undoped Cu12Sb4S13. Kwak et al. [10] obtained a maximum PF of 0.51ŌĆō1.02 mWm-1K-2 at 323ŌĆō723 K for Cu12Sb3.9Bi0.1S13. Bouyrie et al. [11] achieved a maximum PF of 0.96ŌĆō1.48 mWm-1K-2 at 300ŌĆō700 K for Cu12Sb3.48Te0.52S13 (calculated by the Seebeck coefficient and electrical conductivity data in the literature).
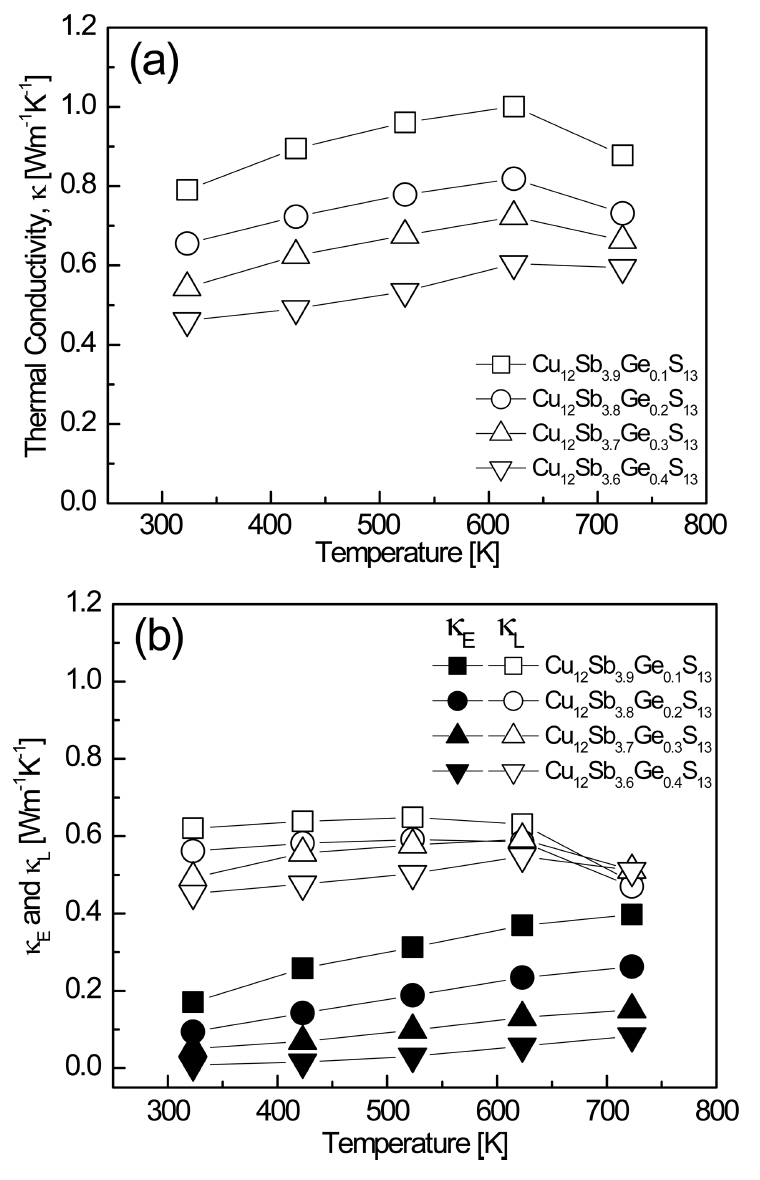
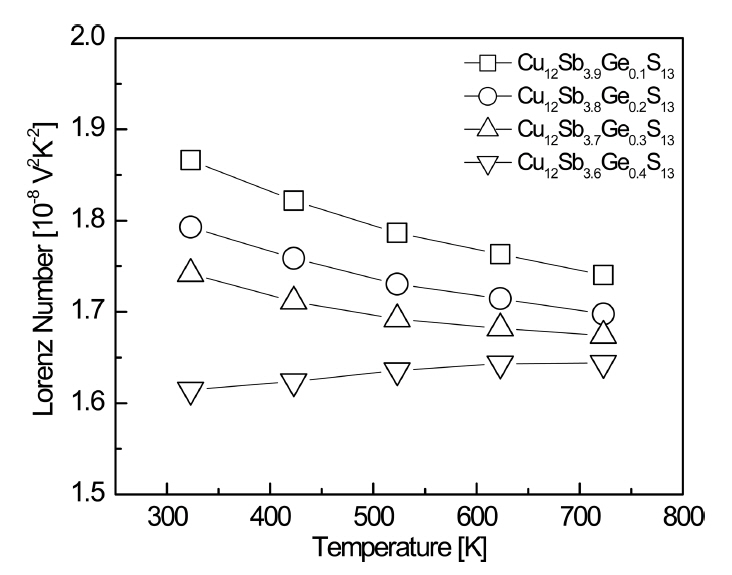
Figure 7 (a) shows the thermal conductivity of Cu12Sb4-yGeyS13. The thermal conductivity initially increased with the temperature, and then decreased at temperatures above 623 K. When the Ge content was increased at a constant temperature, the thermal conductivity decreased, and thus Cu12Sb3.6Ge0.4S13 exhibited a minimum value of 0.46ŌĆō0.59 Wm-1K-1 at 323ŌĆō723 K. Barbier et al. [4] reported relatively high thermal conductivities of 0.92ŌĆō1.25 Wm-1K-1 at 300ŌĆō 690 K for the undoped Cu12Sb4S13. Kwak et al. [10] obtained a low thermal conductivity of 0.63ŌĆō0.78 Wm-1K-1 at 323ŌĆō723 K for Cu12Sb3.6Bi0.4S13 owing to phonon scattering caused by the secondary phase of skinnerite. Bouyrie et al. [11] reported low thermal conductivities of 0.45ŌĆō0.60 Wm-1K-1 at 300ŌĆō700 K for Cu12Sb3.2Te0.8S13. The thermal conductivity has two components: the lattice thermal conductivity (╬║L) and electronic thermal conductivity (╬║E). The ╬║E can be separated using the WiedemannŌĆōFranz law (╬║E = LŽāT, where L is the Lorenz number) [21]. The Lorenz number was calculated using the equation L [10-8 V2K-2] = 1.5 + exp(-|a|/116) [22]. As shown in Fig 8, as the temperature increased from 323 to 723 K, the Lorenz number decreased for y = 0.1-0.3, while it increased slightly for y = 0.4. The Lorenz number decreased as the Ge content increased at a constant temperature, which reflects the behavior of a nondegenerate semiconductor. Cu12Sb3.6Ge0.4S13 exhibited the lowest value of (1.61ŌĆō1.64) ├Ś 10-8 V2K-2 at 323ŌĆō723 K. Pi et al. [23] reported higher values of (1.76ŌĆō1.69) ├Ś 10-8 V2K-2 at 323ŌĆō723 K for an undoped Cu12Sb4S13.
As shown in Fig 7 (b), the ╬║E increased with the temperature. However, the total thermal conductivity in Fig 7 (a) decreased after reaching a maximum value at 623 K, owing to the competition between the ╬║E increase and ╬║L decrease with the increase in temperature. The ╬║E is related to electrical conductivity (carrier concentration) and Lorenz number. Thus, it is consistent with the tendency to decrease as the Ge content increases at a constant temperature. Cu12Sb3.6Ge0.4S13 exhibited the lowest ╬║E of 0.01ŌĆō0.08 Wm-1 K-1 at 323ŌĆō723 K. Kim et al. [16] reported ╬║E of 0.13ŌĆō0.34 Wm-1K-1 at 323ŌĆō723 K for an undoped Cu12Sb4S13. Kwak et al. [10] achieved a lower ╬║E of 0.09ŌĆō0.25 Wm-1K-1 at 323ŌĆō723 K for Cu12Sb3.6Bi0.4S13. Bouyrie et al. [11] obtained very low ╬║E of 0.01ŌĆō0.06 Wm-1K-1 at 300ŌĆō700 K for Cu12Sb2.15Te1.85S13. In this study, the ╬║L decreased with the increase in Ge content. Cu12Sb3.6Ge0.4S13 exhibited the lowest ╬║L of 0.45ŌĆō0.55 Wm-1 K-1 at 323ŌĆō723 K. In this regard, as shown in Fig 7 (a), the total thermal conductivity had the lowest value of 0.46ŌĆō0.59 Wm-1K-1. Kim et al. [16] reported ╬║L of 0.60ŌĆō0.43 Wm-1K-1 at 323ŌĆō723 K for an undoped Cu12Sb4S13. Kwak et al. [10] obtained the lowest ╬║L of 0.57ŌĆō0.38 Wm-1K-1 at 323ŌĆō723 K for Cu12Sb3.6Bi0.4S13. Bouyrie et al. [11] achieved the lowest ╬║L of 0.45ŌĆō0.43 Wm-1K-1 at 300ŌĆō700 K for Cu12Sb2.59Te1.41S13.
Figure 9 compares the dimensionless figures of merit (ZT) for Cu12Sb4-yGeyS13 (y = 0.1ŌĆō0.4) produced by the MAŌĆōHP process in this study and ZT values in the literature upon doping the Sb sites of tetrahedrite. For Cu12Sb4-yGeyS13, the ZT values of all specimens increased with temperature from 323 to 723 K. This resulted from the increase in the power factor and maintenance of low thermal conductivity as the temperature increased. At a constant temperature, as the Ge doping content increased, a high ZT value was maintained. However, when y Ōēź 0.3, ZT decreased, because the power factor decreased as the Ge content increased. Cu12Sb3.8Ge0.2S13 exhibited the highest ZT of 0.74 at 723 K owing to the high power factor (0.77 mWm-1K-2) and low thermal conductivity (0.73 Wm-1K-1). Barbier et al. [4] reported a maximum ZT of 0.60 at 700 K for the undoped Cu12Sb4S13 synthesized by EM and SPS. Therefore, the partial substitution of Ge at the Sb sites of tetrahedrite contributed to the improvement in the thermoelectric performance. Kwak et al. [10] obtained a maximum ZT of 0.88 at 723 K for Cu12Sb3.9Bi0.1S13 prepared by MA and HP. Bouyrie et al. [11] reported a maximum ZT of 0.80 at 623 K for Cu12Sb3.39Te0.61S13 synthesized and consolidated using EM and SPS. In this study, the solid-state synthesis using MA provided a single tetrahedrite phase without additional post annealing, in a relatively short time period of 24 h, and excellent thermoelectric performance of the Ge-doped tetrahedrites could be achieved.
4. CONCLUSIONS
Ge-doped tetrahedrites Cu12Sb4-yGeyS13 (y = 0.1ŌĆō0.4) were synthesized by MA, and then sintered by HP to produce dense specimens. The lattice constant was reduced by Ge doping, which indicated that Ge4+ with a smaller ionic radius was substituted at the Sb3+ sites. Ge-doped tetrahedrites are p-type nondegenerate semiconductors, as confirmed by the Hall coefficient, Seebeck coefficient, and Lorenz number. As the Ge doping level increased at a constant temperature, the electrical conductivity decreased, while the Seebeck coefficient increased. The Ge doping at Sb sites was expected to reduce the carrier (hole) concentration despite Hall measurement errors. In addition, the Ge doping reduced both electronic thermal conductivity and lattice thermal conductivity, and thus the total thermal conductivity decreased. Cu12Sb3.9Ge0.1S13 exhibited a maximum power factor of 0.87 mWm-1K-2 at 723 K. However, when the Ge content increased, the effect of decreasing electrical conductivity was dominant over that of increasing the Seebeck coefficient, resulting in a decrease in power factor. As a result, the highest ZT (0.74) was achieved at 723 K for Cu12Sb3.8Ge0.2S13.