Influence of Elevated Temperature on the Mechanical and Microstructural Properties of Glass Fiber-Reinforced Polymers
Article information
Abstract
Glass fiber-reinforced polymers (GFRPs) have attracted significant attention as structural materials because of their high fatigue resistance, corrosion resistance, strength, and stiffness. This study examined the effect of elevated temperatures (150, 250, 350, and 450°C) on the microstructural and mechanical properties of GFRP plates. The number of bubbles increased as the firing temperature increased, and the bubbles burst at 250°C or higher, forming pores on the surface. A tensile test was conducted, and the maximum stress of the GFRP plates fired at 150, 250, and 350°C was reduced from 54.2 to 52.2, 40.3, and 24.0 MPa, respectively, compared to that of the unfired GFRP plate. Meanwhile, the elastic moduli of the GFRP plates fired at 150, 250, and 350°C reduced from 19.1 to 18.3, 16.1, and 12.1 GPa, respectively, compared to that of the unfired GFRP plate. This reduction in the mechanical properties of the GFRP plates at elevated temperatures was attributed to the degradation of the mechanical properties of the resin matrix due to glass transition and decomposition, debonding, and an increase in surface defects. The maximum strain decreased gradually with increasing firing temperature, suggesting that the brittleness of the GFRP plates increased at elevated temperatures.
1. INTRODUCTION
The use of fiber-reinforced polymer (FRP) composites has grown at an extraordinary rate since the 1960s because of their multiple advantages, including high strength-to-weight ratios, durability, corrosion resistance, flexibility, and fatigue properties [1-5]. FRP composites, such as carbon FRP (CFRP), glass FRP (GFRP), and basalt FRP (BFRP), have a wide range of applications in aircraft, ships, automobiles, and civil infrastructure [6-8]. For example, Miller et al. [9] investigated CFRP-reinforced bridge girders, and determined their stiffness was increased by 10–37% compared to that of non-reinforced bridge girders. Furthermore, they applied CFRP composites to a bridge located on Interstate 95 in Newark, Delaware, and the bridge exhibited an 11.6% improvement in global flexural stiffness.
GFRP composites are also considered to have great potential as structural materials for civil engineering applications such as bridge structures, owing to their remarkable mechanical properties and low weight. Bakis et al. [10] asserted that GFRP materials have high fatigue and corrosion resistance, as well as increased strength and stiffness per unit weight compared to traditional steel and reinforced concrete structures. However, the application of GFRP composites in civil engineering has been restricted because of their weak jointing systems, low elasticity modulus, and absence of yield points [11–13]. In particular, the degradation behavior of GFRP composites at elevated temperatures has raised significant attention. Kumahara et al. [14] studied GFRP-reinforced bars with two different types of resin (vinyl ester and polyphenylene sulfide) exposed to elevated temperatures between 60 and 400°C. They found that when the temperature reached 250 and 400°C, the bars reinforced with vinyl ester lost 40% and 60% of their primary strength, respectively, whereas the bars reinforced with polyphenylene sulfide did not experience the negative effects of heating up to 250°C. Ashrafi et al. [15] investigated the tensile strength of GFRP bars with different diameters subjected to elevated temperatures (15–300°C). The tensile strength exhibited no significant changes at temperatures up to 60°C; however, as temperature reached the glass transition temperature of the resin matrix, a sudden drop in tensile strength was observed due to resin softening. At temperatures higher than 200°C, a strength reduction of more than 65% was observed owing to significant resin degradation and consequent resin/fiber debonding.
Wang and Zha [16] studied GFRP bars under elevated temperatures and reported tensile strength reductions of 22% and 67% at temperatures of 120 and 500°C, respectively. Ellis et al. [17] investigated the residual tensile properties of GFRP bars by heating the bars up to 400°C and then cooling them down to room temperature. They demonstrated that GFRP bars retained 83% of their room temperature tensile capacity after heating them to 400°C and cooling to room temperature. Manalo et al. [18] studied the flexural behavior of GFRP skins and a phenolic core sandwich under temperatures ranging from room temperature to 180°C. According to their experiments, all the samples retained more than 80% of their initial flexural strengths at 80°C, while at 150°C the corresponding values for the GFRP skins and sandwich beams were 40% and 19%, respectively. Schmidt et al. [19] studied two pultruded GFRP laminates with different resins (isophthalic polyester and phenolic resins) subjected to elevated temperatures. They concluded that the laminates with phenolic resin exhibited better flexural properties than those with isophthalic polyester.
There are various types of glass fibers, including alkali, chemical, electric, and strength–glass fiber. Electric-glass fiber (E-Glass fiber) is the most frequently applied to GFRP composites because of its chemical resistance and relatively low cost. Generally, FRP composites consist of fiber reinforcement and a resin matrix. The degradation of FRP composites at elevated temperatures is greatly affected by the properties of the resin matrix, rather than those of the fiber reinforcement, because of the high ignition temperatures of the fibers.
The GFRP matrix undergoes softening and combustion processes above the glass transition temperature (Tg) and decomposition temperature (Td), respectively [20]. Above Tg, the matrix softens and becomes rubbery, leading to degraded mechanical properties due to the reduced ability to transfer shear loads between fibers [21,22]. Above Td, the matrix starts decomposing into toxic fumes and various other phases, significantly reducing the mechanical performance of the GFRP materials [15,22].
This study investigated the microstructural and mechanical properties of GFRP plates exposed to elevated temperatures of 150, 250, and 350°C. Tensile tests were performed, and the maximum stress, maximum strain, and elastic modulus were calculated and analyzed.
2. MATERIALS AND METHODS
Plate-type GFRP composites, produced via pultrusion, consist of a phenolic resin matrix and glass fiber reinforcement [23]. An unfired GFRP board (G0) with a width of 30 mm, length of 20 mm, and thickness of 1 mm was cut into 10 mm2 square plates. The G0 samples were fired at different temperatures of 150, 250, 350, and 450°C for 30 min and cooled in a furnace. The G0 samples heat-treated at 150, 250, 350, and 450°C are denoted as G150, G250, G350, and G450 (the sample codes are listed in Table 1). The crystalline phases of the samples were identified using X-ray diffraction (XRD, D8 Discover, Bruker, USA) at 40 kV and 40 mA in the 2θ range of 10°–60° at a scan speed of 3°/min using Cu Kα1 radiation. The structures of the samples were examined using Fourier-transform infrared (FT-IR) spectroscopy (VERTEX 80V, Bruker, Germany) at test wavelengths of 500–4000 cm–1. The surface microstructures of the samples were observed using field-emission scanning electron microscopy (FE-SEM, SU8010, Hitachi, Japan). The surfaces of the samples used for the FE-SEM observations were coated with Pt. The stress–strain curves of the samples were obtained using a universal testing machine (311.31, MTS Systems Corp., USA). The maximum stress (tensile strength), maximum strain, and elastic modulus of each sample were calculated from the stress–strain curves.
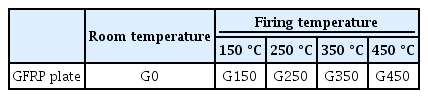
Sample codes for the GFRP plates fired at different temperatures.
3. RESULTS AND DISCUSSION
Figures 1(a)–(e) show photographs of G0, G150, G250, G350, and G450, respectively. After the heat treatment, the samples exhibited a significant change, which was visible to the unaided eye. The colors of G0, G150, G250, and G350 became darker as the firing temperature increased, which was partially attributed to the oxidation of the phenolic resin matrix [22]. Finally, for G450, the resin matrix completely evaporated, and only the glass fibers remained.
Photographs of the GFRP plates: samples (a) G0, (b) G150, (c) G250, (d) G350, and (e) G450.
Figure 2(a) shows the XRD patterns of samples G0, G150, G250, and G350, while Figures 2(b) and (c) show the XRD patterns of samples G0 and G350, respectively. The broad peak at ~25° corresponds to the amorphous halo of the glass fiber [24], and a broad peak at ~20° overlapping with the peak of the glass fiber corresponds to the amorphous halo of the phenolic resin matrix [25]. As shown in Figure 2(b), various components of GFRP were identified: color index (C.I.) Solvent Yellow 56, also called 1-phenylazo-4-N,N-diethylaniline (C16H19N3, JCPDS #00-047-2143), nylon ((C15H27N3O3)n/(CO(CH2)6NHCO(CH2)4NHCO(CH2)2NH)n, JCPDS #00-047-2017), and alumina (Al2O3, JCPDS #00-047-1771). C.I. Solvent Yellow 56 is a synthetic organic dye belonging to the azo dye family, which is widely used as a coloring agent in various applications. The peaks for C.I. Solvent Yellow 56 disappeared at temperatures above 250°C, which was in accordance with the fact that the G250 sample lost most of its initial color, as shown in Figure 1(c).

(a) XRD patterns of samples: G0, G150, G250, and G350. XRD patterns of samples: (b) G0 and (c) G350. (d) FT-IR spectra of samples: G0, G150, G250, and G350.
Nylon is a synthetic fabric material that is generally used as a peel ply in FRP composite fabrication processes. Peel ply is an extra layer made of synthetic or natural fabric materials, such as nylon, polyester, and glass fiber, used to achieve a smooth and textured surface finish on the final product. A peel ply is applied to the surface of the composite laminate during curing and is subsequently removed. However, during the curing cycle in the composite manufacturing process, the peel ply fabric absorbs some of the matrix resin and becomes an integral part of the laminate, causing the appearance of nylon peaks in the XRD patterns [26]. Alumina is a common additive used for the synthesis of E-glass fibers that exhibit good mechanical, electrical, and chemical properties [27].
As shown in Figure 2(c), when the GFRP plate was exposed to a temperature of 350°C, the peaks for C.I. Solvent Yellow 56 and nylon no longer existed, indicating the volatilization or thermal decomposition of additives at elevated temperatures. Only the small peaks corresponding to alumina remained, suggesting that alumina potentially diffused into the glass fibers while the glass fibers themselves remained intact.
Figure 2(d) shows the FTIR spectra of G0, G150, G250, and G350. The FT-IR spectra exhibited similar band patterns for all samples. The largest band centered at 1020 cm–1 corresponds to the stretching modes of the Si–O–Si groups in the glass fiber, and the band at 487 cm–1 was attributed to absorption by Si–O groups [28,29]. The bands centered at 2919 and 2851 cm–1 were assigned to C–H groups, and the band at 1477 cm–1 was due to C–H bending in the methylene groups of the phenolic resin [30]. The bands between 3200 and 3600 cm–1 are characteristic of the O–H stretching modes, which are due to the structure of the phenolic resin. Therefore, the FT-IR results confirm that the GFRP plate samples consisted of glass fiber reinforcements and a phenolic resin matrix.
Figures 3(a)–(d) and 4(a)–(d) show low-magnification (×100) and high-magnification (×1000) FE-SEM images of the G0, G150, G250, and G350 samples, respectively. Some surface defects such as debonding, fiber breakage, delamination, and bubbles were observed in the G0 and G150 samples. These surface defects are known to form after the machining of FRP composites. Morkavuk et al. [31] reported that the machining process can produce defects such as debonding, micromatrix cracking, delamination, fiber pullout, and fiber breakage due to the applied stress and generated heat.

Low-magnification (×100) FE-SEM images of samples: (a) G0, (b) G150, (c) G250, and (d) G350.
High-magnification (×1000) FE-SEM images of samples: (a) G0, (b) G150, (c) G250, and (d) G350.
No significant difference was observed between the G0 and G150 samples in the low-magnification FE-SEM images (Figure 3); however, the high-magnification images showed that the surface of the G150 sample was covered with more bubbles than the G0 sample. For the G150 sample, these bubbles were generated by the air in the intrinsic voids near the surface, which were expanded by firing and pushed out the phenolic resin matrix. At 250°C, many of these bubbles burst from overstress and generated pores on the surface (Figure 5(c)).
(a) Failure modes of specimens: G0, G150, G250, and G350. Cross-sectional failure modes of specimens: (b) G0, (c) G150, (d) G250, and (e) G350.
For the G350 sample, more pores were observed compared to the G250 sample, and some pores merged to form larger pores. In addition, the pores and microcracks joined with the delaminated region, which can cause severe damage to the resin matrix [32].
Figure 5 shows the failure modes of the specimens after exposure to elevated temperatures. Specimens G0 and G150 exhibited similar failure modes. Fiber pull-out, fracture, and delamination were observed in these specimens. For the G250 and G350 specimens, resin ignition and severe delamination occurred, and numerous fiber fractures were observed in the cross-sectional photographs of the specimens, which can be attributed to the glass transition and decomposition of the resin matrix at the temperatures above Tg and Td, respectively. Bazli et al. [33] demonstrated that as the temperature increases, fiber separation and delamination occur with resin softening and ignition.
Figure 6(a) shows the stress–strain curves for specimens G0, G150, G250, and G350. The maximum tensile stress (σmax), maximum strain (εmax), and elastic modulus (E) were obtained from the stress–strain curve of each specimen and are listed in Table 2. Figures 6(b) and 6(c) present the σmax and E for the specimens, respectively. The σmax values were 54.18, 52.16, 40.26, and 24.02 MPa for G0, G150, G250, and G350, respectively. The σmax values of G150, G250, and G350 decreased by 3.73, 25.69, and 55.67% compared to that of G0. In addition, the E values of G150, G250, and G350 also decreased by 3.78, 15.70, and 36.59% compared to that of G0.
(a) Stress–strain curves of specimens: G0, G150, G250, and G350. (b) σmax, (c) E, and (d) εmax of specimens: G0, G150, G250, and G350.

Maximum force, maximum displacement, σmax, εmax, and E of GFRP plates exposed to various temperatures.
The σmax and E decreased gradually with increasing temperature. The mechanical degradation of the FRP composites at elevated temperatures was in agreement with previous studies. For instance, Sayed-Ahmed et al. [34] found that the exposure of FRP tendons to temperatures of 200, 300, and 400°C reduced their strength by approximately 10, 37, and 74%, respectively. Further, Wang et al. [16] demonstrated that GFRP bars under elevated temperatures of 120 and 500°C decreased their tensile strength by 22 and 67%, respectively. Cao et al. [35] also reported that the tensile strength of FRP sheets were reduced when they were exposed to a temperature of 200°C. The reduction in σmax and E was attributed to various factors such as the degradation of the mechanical properties of the resin matrices due to glass transition and decomposition, debonding, and an increase in surface defects. Jarrah et al. [36] asserted that the glass transition and thermal decomposition of the resin matrix greatly reduced the tensile strength of GFRP and CFRP sheets. They also reported that the tensile strengths of FRP sheets decreased because of the formation of cracks due to oxidation, leading to debonding and a further reduction in the tensile strength of the specimens.
Figure 6(d) shows the εmax values of each specimen. The εmax values were 0.33, 0.32, 0.26, and 0.22% for G0, G150, G250, and G350, respectively. The εmax values decreased gradually with increasing firing temperature, which indicates that the brittleness increased with increasing temperature. Brittle fractures of FRP composites can cause cracks and lead to mechanical failure during operational service, even at low mechanical loads [37]. Therefore, it can be concluded that the high brittleness of the heat-treated samples caused their degraded mechanical strength. Furthermore, as shown in Figure 4(d), numerous large pores, microcracks, and severe delamination were observed on the surface of the G350 sample, which is in accordance with its high brittleness and a significant decrease in its mechanical properties.
4. CONCLUSIONS
The influence of elevated temperatures on the microstructure and mechanical properties of GFRP plates was investigated. A series of GFRP plates were heat-treated at temperatures of 150, 250, 350, and 450 °C. Most of the phenolic resin matrix of the G450 sample decomposed and only the glass fibers remained. The XRD and FT-IR results confirmed the presence of a glass fiber-reinforced phenolic resin matrix. Surface defects such as debonding, fiber breakage, delamination, and bubbles were observed for the unfired G0 and G150 samples, which were attributed to the machining process of the GFRP composites. The surface of the G150 sample was covered with more bubbles than that of the G0 sample, and the bubbles formed because the air in the intrinsic voids near the surface were expanded by firing, and pushed out the phenolic resin matrix. Those bubbles burst from overstress at 250°C and generated pores on the surface. Small pores merged to form larger pores, and microcracks were identified on the surface of the G350 sample. The σmax values of the GFRP plates heat-treated at 150, 250, and 350°C substantially decreased from 54.18 to 52.16, 40.26, and 24.02 MPa, which corresponds to a reduction of 3.73, 25.69, and 55.67%, respectively, compared to that of the unfired GFRP plate. Further, the E values of the GFRP plates fired at 150, 250, and 350°C gradually decreased from 19.05 to 18.33, 16.06, and 12.08 GPa, which corresponds to a reduction of 3.78, 15.70, and 36.59%, respectively, compared to that of the unfired GFRP plate. The degradation of the mechanical properties of the GFRP plates at elevated temperatures was caused by various factors, such as the degradation of the mechanical properties of the resin matrix due to glass transition and decomposition, debonding, and an increase in surface defects. The εmax values decreased gradually with increasing firing temperature, suggesting that the brittleness of the GFRP plates increased at elevated temperatures.
Notes
DATA AVAILABILITY STATEMENT
Data available on request from the authors.
Acknowledgements
This study was supported by the National Research Foundation of Korea (NRF-2021R1A4A1031201) for Sungmo Choi. Also, this study was supported by the 2023 Research Fund of University of Seoul for Sangil Kim.