Influence of Nanosized AlN Powders on the Microstructure, Brazeability, and Tensile Properties of Al-based Filler for Low Temperature Al/Cu Dissimilar Brazing
Article information
Abstract
This study examined the influence of nanosized aluminum nitride (AlN) powders (0, 0.01, 0.05, 0.10, 0.30, and 0.50 wt%), on an Al4047-based filler metal. Nanosized AlN powders were dispersed uniformly into the filler metal by a mechanical mixing and melting route using a stainless steel propeller. The influences of nanosized AlN powders on the melting behavior, microstructure, brazeability, and tensile properties were examined, and interfacial reactions between aluminum and copper were carried out. The experimental results showed that the thicknesses of Si and IMC keep decreasing with additions of nanosized AlN powders up to 0.10% in the brazing filler metal, which is attributed to the adsorption theory of nanosized AlN powders on the surface of Si and IMCs. In addition, the AlN-reinforced filler metal with 0.10 wt% samples showed a 2.61% enhancement in wettability due to the decreased surface tension in the filler metal matrix in the presence of nanosized AlN powders. Furthermore, aluminum to copper dissimilar brazing with 0.10 wt% AlN-reinforced filler metal showed a 16.07% improvement in the tensile strength compared to the 0% AlN filler due to the grain refinement of a filler metal matrix by the Orowan strengthening effect.
1. INTRODUCTION
Aluminum and its alloys have been used widely in various fields, such as material, electronics, aerospace, and structural industries due to their outstanding mechanical, thermal, and electrical properties, lightweight characteristics, and corrosion resistance [1–3]. Therefore, the bonding technology of Al and its alloys is the most important consideration in the Al industry because higher reliability of Al cannot be achieved without appropriate bonding technology. This suggests that adequate bonding with a higher property of Al and its alloy is essential for accomplishing outstanding Al bonding. Some of the bonding technologies of Al and its alloy used in Al industries are mechanical bonding, adhesive bonding, welding, and brazing. Among them, Al brazing is one of the most notable Al bonding technologies due to its higher bonding strength and productivity. In addition, an important advantage of brazing enables not only bonding of similar materials but also bonding of dissimilar metals or ceramics with filler metals. In the brazing technology, a brazing joint is formed by melting a filler metal that has a melting temperature higher than 450°C without melting the base metal.
Generally, the conventional Al filler metal, which is Al4047 based on Al-12 wt% Si, is used in the brazing industry because Si decreases shrinkage defects and increases the fluidity of the molten filler metal. However, the melting temperature of the conventional filler is approximately 570°C, which is very close to Al and its alloys. This causes localized melting and degradation of the base metal after brazing, which degrades the brazed joint with cracks and failure at the joint [4]. Moreover, the formation of large Si particles becomes a serious issue at the joint due to brittleness. Therefore, the development of a new filler metal with a lower melting point and higher mechanical properties is essential for Al brazing.
Some previous studies have reported the development of filler metals with a low melting temperature for Al brazing. Humpston et al. suggested an Al-20 wt%Cu-2 wt%Ni-5 wt%Si filler with a melting temperature of approximately 525.85°C [5], and Suzuki et al. also examined a Al-4.2 wt%Si-40 wt%Zn-Sn filler with a melting point of approximately 535°C [6]. However, a large amount of Cu causes a brittle failure at the brazed joint [7]. In addition, Zn is inappropriate for vacuum brazing because of its higher vapor pressure. Kayamoto et al. developed an Al-Ge-Si-Mg filler system with a melting point of approximately 565°C [8]. However, the cost of Ge is too high to use in the brazing process.
The brazing of aluminum and copper is mainly used in automobile, structural, and particularly heat exchanger industries. In this combination, the formation of CuAl2 intermetallic compounds (IMCs) becomes an issue because it can result in cracks and pores at the brazed joint [9,10]. Therefore, it is essential to suppress the IMC growth and refine the Si particles in the filler metal.
A method with the most potential for suppressing IMCs and refining Si particles in the matrix is the addition of nanosized materials in the filler metal that improves the mechanical properties as well as the brazeability owing to the higher surface energy of the nanosized materials [11–13]. According to Hausner et al., low temperature brazing was achieved using Ag nanopaste, but the cost of Ag is always a big issue [14]. In addition, Karantzalis et al. reported the addition of nanosized TiC powders in the Al-Si-Cu system to increase the wettability of the filler metal. However, the IMC growth caused degradation of the brazed joint [15]. Although there have been some studies on the nano-reinforced Al filler metal, no study has reported using nanosized aluminum nitride (AlN) powder in the filler metal for Al and Cu dissimilar brazing for heat exchanger applications. AlN, which is non-toxic ceramic material, is regarded as a promising material owing to its lightweight characteristics, superior electrical properties, low cost, and excellent corrosion resistance [16,17].
This study developed a new Al filler metal with nanosized AlN powders with a low melting point and high mechanical properties to minimize the above-mentioned problems of existing Al fillers. Here, Sn and Cu act to increase the brazeability and decrease the melting temperature, respectively. Moreover, the influence of nanosized AlN powders in the filler metal on the microstructure, melting behavior, brazeability, and tensile properties of Al and Cu dissimilar brazing is examined.
2. EXPERIMENTAL PROCEDURES
2.1 Preparation and fabrication of AlN-reinforced filler
Al4047 filler metal and pure Al, Cu, and Sn were prepared to fabricate a new filler metal (Al-11 wt% Si-19 wt% Cu-2 wt% Sn) for Al and Cu dissimilar brazing. Nanosized aluminum nitride (AlN) powder with an average particle diameter of 100 nm was also selected as a reinforcement material with a various amounts of AlN (0, 0.01, 0.05, 0.10, 0.30, and 0.50 wt%). Table 1 lists the new filler metals used in this study.
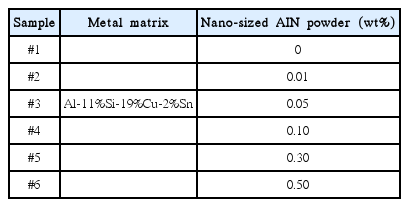
AlN-reinforced filler metal with different weight percentages of AlN.
To obtain a homogeneous distribution of AlN in the filler metal, a mechanical mixing and melting route using a stainless steel propeller were employed. Afterward, the filler metals reinforced with nanosized AlN powders were heated by induction furnace at approximately 650°C for 10 minutes and stirred by the propeller. Finally, AlN-reinforced fillers were casted in a graphite crucible and cooled down to room temperature at 0.2°C/min.
2.2 Characterization of AlN-reinforced filler
The microstructural analysis of the new filler metal with the various amounts of AlN was investigated using FE-SEM (Hitachi 4800). The AlN-reinforced filler metals were ground using SiC sandpaper, polished using Al2O3 suspensions, and subsequently etched using a 10 vol% H3PO4 solution for 1 min to obtain a clear microstructural image of the filler metal. In addition, the compositions of AlN-reinforced fillers were analyzed by EDS and the IMC thicknesses were measured using the Image-Pro 6.0 program.
2.3 Melting behavior
The melting points of the AlN-reinforced filler were investigated by DSC. The fillers were heated in Al2O3 pans from room temperature to 600°C at a heating rate of 10°C/min in an Ar atmosphere to prevent contamination from stray oxygen.
2.4 Brazeability
Figure 1 shows the schematic diagram of the spreading test of the filler. The 99.99% Cu coupons (30 × 30 × 0.3 mm) were prepared as substrates for the filler spreading test. Ten spreading tests were performed for samples according to the standard of JIS-Z-3197.

Schematic diagram of spreading test on Cu substrate using AlN reinforced filler.
Generally, the spreading property of the filler depends on the spreading ratio and angle in the spreading test. Here, a higher spreading ratio and lower angle indicate better brazeability of the filler; the spreading ratio is calculated according to the equation follow [18].
where S is the spreading ratio, D is the diameter of the filler when it is assumed to be a sphere, and H is the height of the filler after the spreading test.
The spreading test for the filler was as follows. First, the Cu coupon was polished and cleaned to remove any contamination. Second, the Cu coupon was pre-heated at approximately 100°C for 1 hour to obtain a uniform oxidized Cu. Third, 0.10 g of various fillers with a noncorrosive Al flux (Lucas Milhaupt, DF751) was placed on the center of the Cu coupon. Finally, the AlN-reinforced fillers were heated at approximately 530°C for 30 seconds using an induction heating furnace and the filler metal was cooled at room temperature.
2.5 Tensile property
Figure 2 shows the Al and Cu dissimilar brazing sample for the tensile test. A Cu plate (60 × 15 × 3 mm) and an Al 3003 plate (60 × 15 × 3 mm) were brazed using an AlN reinforced filler metal with an induction heating furnace. The tensile testing was carried out at a crosshead speed of 0.5 mm/min and a strain rate of 0.001/sec according to ASTM E8 standards. The ultimate tensile strength (UTS) and percent elongation were obtained from the stress-strain curves after the tensile testing. For accuracy, five samples were tested for each condition.
Schematic diagram of tensile test after Al/Cu dissimilar brazing.
2.6 Aluminum and copper dissimilar brazing
Al and Cu dissimilar brazing using the AlN-reinforced filler was conducted using an induction heating furnace (PSTEK, HF-15) at an input power of 40 to 60 kW for 5 to 10 sec. A non-corrosive flux for Al and Cu brazing was used to prevent any oxidation and improve the wettability of the filler. Afterwards, a microstructural analysis of the brazed joint was conducted to observe the IMC growth behavior and the phases at the joint interface using field emission scanning electron microscopy (FE-SEM), and energy dispersive spectroscopy (EDS). Furthermore, the brazed interface between Al and Cu was examined using FE-SEM and EDS.
3. RESULTS AND DISCUSSIONS
3.1 Microstructure of the filler metal
Figure 3 shows the microstructural images of the filler with various amounts of nanosized AlN powder. Normally, the filler is composed primarily of Si as well as the CuAl2 IMC. There were large sized Si (100at%Si) and CuAl2 IMC (Cu-64.79at%Al) in the 0% AlN-reinforced filler, as shown in Fig. 3(a). Note also that Al rich (Al-1.21 at%Si-5.13at%Cu-0.51 at%Sn) and Sn rich (Sn-1.75at%Al-0.28at%Si-2.14at%Cu) phases were present in the 0% AlN-reinforced filler. However, the thicknesses of both Si and CuAl2 IMCs decreased slightly with the addition of 0.01% AlN in the filler, as shown in Fig. 3(b). In addition, both the thicknesses of Si and IMCs continued to decrease by further addition of nanosized AlN powders up to 0.10% in the filler, as shown in Figs. 3(c) and 3(d).

FE-SEM images of (a) 0% AlN, (b) 0.01% AlN, (c) 0.05% AlN, (d) 0.10% AlN, (e) 0.30% AlN, and (f) 0.50% AlN in the Al filler matrix.
On the other hand, the thickness of the IMCs began to increase again at 0.30% AlN in the filler due to the excessive AlN in the filler, as shown in Fig. 3(e). Finally, the IMCs gradually continued to increase up to 0.50% AlN in the filler, as shown in Fig. 3(f). We inferred that the nanosized AlN powders can affect the morphology and thickness of the Si as well as CuAl2 IMCs with the optimal amount of AlN in the matrix.
This can be explained by the adsorption theory of nanosized AlN powders on the surface of Si and IMCs [19,20]. According to this theory, the surface free energy of Si and IMCs decreases and that results in decreasing growth of the IMCs with increases in absorption amounts of surface-active AlN nanosized powders. In other words, nanosized AlN powders act as a type of surface-active materials in the Si and IMCs and decrease their surface free energy, which results in refined Si and IMCs. Here, the optimal amount of AlN powders for maximum adsorption on their surface can be expressed as follows [21]:
where ΓK is the amount of nanosized AlN powders which is adsorbed per unit area at the kth plane, C is the total amount of AlN powders, RT is the thermal energy per mole, and γK is the surface energy per unit area of the kth plane without adsorption of AlN powders. From the equation (4), the kth plane indicates the microscopic concept on the surface of the solder. Here, equation (5) can be obtained by integrating equation (4) as follows:
where
where
To investigate the influence of nanosized AlN powders on the microstructure of the filler, the average Si and CuAl2 IMC thicknesses were calculated at different 20 random locations and plotted, as shown in Fig. 4. It is observed that the thickness of Si was approximately 9.11 μm with 0% nanosized AlN powders in the filler. However, the Si thickness rapidly decreased to 8.57, 5.34, and 5.19 μm at 0.01, 0.05, and 0.10% AlN in the filler, respectively.

CuA12 IMC thickness and Si particles size with various AlN nanoparticle concentrations in the Al filler matrix.
Afterwards, the thickness gradually increased again by further addition of nanosized AlN powders in the filler to 6.17 and 6.89 at 0.30 and 0.50% AlN, respectively. In the case of CuAl2 IMC thickness, it was 28.34 μm with 0% nanosized AlN, but it decreased to approximately 26.19, 18.37, and 15.58 μm at 0.01, 0.05, and 0.10% AlN in the filler, respectively. Afterward, the thickness of the CuAl2 IMC increased to 20.14 and 21.59 μm after further addition of 0.30 and 0.50% nanosized AlN powders in the filler, respectively. We inferred that the incorporation of nanosized AlN powders in the filler act as an obstacle of the growth of the Si as well as the CuAl2 IMC at their optimal amount. This was also due to the adsorption phenomenon by nanosized AlN powders on the surface of the filler owing to the adsorption theory of surface-active metals [19,20].
However, the thicknesses of both the Si and the CuAl2 IMC increased again after addition of excessive AlN powders in the filler. This is associated with the following reason. An excessive amount of AlN powders in the filler are easily agglomerated due to their reduced inter-particle spacing and higher surface energy [21]. Therefore, bunches of big agglomerated AlN can cause the non-uniform distribution of AlN and pores that result in crack propagation in the filler.
3.2 Melting behavior
Figure 5 shows the melting behaviors of the filler with a different amounts of nanosized AlN powder. There were two endothermic peaks and the melting temperature of the fillers ranged from 524.5 to 528.7°C. The liquidus point of the 0% nanosized AlN powders in the filler was approximately 528.3°C. However, it decreased to 527.7, 525.9, and 524.5°C with additions of 0.01, 0.05, and 0.10% AlN in the filler, respectively. Furthermore, the liquidus point increased again to 526.8 and 528.7°C at 0.30 and 0.50% AlN in the filler, respectively.
Melting behaviors of the Al filler matrix with various AlN concentrations.
This suggests that the presence of nanosized AlN powders in the filler can result in a reduction of the surface energy of an Al filler that causes a drop in the melting temperature. In addition, an increase in the number of surface atoms and phonon vibrations can exceed the atomic average square displacements, which creates a thermal deformation of the lattice, which decreaes the melting temperature [22].
However, the increases in melting temperature with the addition of nanosized AlN powders up to 0.50% were due to the excessive AlN powders in the filler, which in turn resulted in the agglomeration with a decrease in inter-particle distance. This suggests that the agglomerated AlN powders could not further influence the change in the melting temperature in the filler [12,13]. Furthermore, the melting temperature of the filler increased again due to the melt undercooling before solidification of Al [23].
3.3 Brazeability
Figure 6 shows the spreading ratios of the fillers on the Cu plate with different amouts of AlN. It is known that an increase in the spreading ratio as well as the spreading area means an increase in the brazeability of the filler [24]. The spreading ratio drastically increases with an addition of nanosized AlN powders up to the 0.10% AlN in the filler. For example, the spreading ratio gradually increased with the addition of nanosized AlN powders, i.e., the spreading ratio of 74.97% with 0% AlN and 75.18% with 0.01% nanosized AlN powders. The spreading ratio was 76.36% in the 0.05% nanosized AlN powders in the matrix and 76.93% in the 0.10% AlN condition, which is the maximum value of the spreading ratio. The increase in spreading ratio was due to a uniform distribution of nanosized AlN powders in the filler, which resulted from the decrease in the surface tension and increase in the fluidity of the filler [25]. In addition, this was due to the reduction in the interfacial energy of the AlN-reinforced filler in the presence of high energy nanosized AlN powders by suppressing the surface energy of the melt.
Spreading ratios of the AlN-reinforced Al filler matrix on the Cu substrate with various AlN concentrations after the spreading.
However, the spreading ratio gradually decreased again to the 75.75 and 74.87% in the 0.30 and 0.50% AlN nanoparticles, respectively, in the matrix. This was due to the non-uniform distribution of AlN powders with many pores during solidification of the filler. In this case, some remaining AlN powders can be floated on the filler. Moreover, excessive AlN powders in the molten metal can cause them to outgas from the melt resulting in segregation of nanoparticles and a poor spreading ratio [20]. Therefore, a higher number of nanoparticles degrades the spreadability of the filler metal. This result is consistent with previous studies on nano-reinforced filler with La2O3 and SiC particles [12,13]. From our brazeability results, the optimal amount of filler was revealed as 0.10% AlN powders in the filler.
3.4 Tensile property
Figure 7 shows the tensile strength and elongation curves of Al/Cu dissimilar brazed samples with AlN reinforced filler metal with their fracture specimens after tensile testing. It is observed that all the fractures occurred at the Al3003 side, which indicated a sound brazing property. It is also noted that the tensile strength was 51.03 MPa in the 0% AlN nanoparticles and it gradually increased to 53.70 and 59.23 MPa in the 0.05 and 0.10% AlN nanoparticles, respectively. This increment in tensile strength can be explained by the refinement of eutectic Si particles and CuAl2 IMC due to the AlN nanoparticles in the matrix.

(a) Stress-strain curve with a different AlN contents in the Al filler matrix, and (b) the fractured samples after tensile testing.
This increase in tensile strength of the filler metal by the AlN nanoparticles was due to the combined effect of the four factors, namely, the Hall-Petch equation, effective load carrying capacity, Orowan strengthening effect, and enhanced dislocation density due to the mismatch in CTE between the filler metal matrix and AlN nanoparticles. As the result, these four factors finally led to the increase in tensile strength of the reinforced filler metal by AlN nanoparticles.
However, the tensile strength slightly decreased back to 56.60 MPa with an increase of the AlN nanoparticles to 0.30% in the matrix. This phenomenon was due to the higher porosity which was caused by excessive AlN nanoparticles and agglomerated AlN nanoparticles in the filler metal matrix, which caused crack propagation and degrading tensile strength of the filler matrix. In other words, the AlN nanoparticles tended to agglomerate to reduce their surface energy if they could not obtain a minimum distance for their uniform dispersion in the matrix [26].
The elongation value was 9.23% in the 0% AlN nanoparticles and it drastically increased to 15.81% and 16.59% in the 0.05 and 0.10% AlN, respectively. The increase in elongation of the reinforced filler metal may have been due to the slip mode transition by the AlN nanoparticles, which depends on the interaction of AlN with the interface of the filler metal matrix [27]. Moreover, it may be easy for a plastic deformation to be transformed from dislocation reinforcement shearing to dislocation reinforcement bypassing because of the very small size of the AlN nanoparticles. As a result, AlN nanoparticles can obstruct the movement of dislocation around the interface of the filler metal matrix. On account of the cross-slip formation, the elongation of filler metal can increase by breaking up agglomerates and re-distributing AlN [28].
However, the elongation decreases to 15.24% in the 0.30% AlN nanoparticles due to the re-distribution of the agglomerated or broken IMCs in the filler matrix by excessive AlN. This suggests that the increase in elongation is associated with the refinement and good dispersion of various phases, such as Si particles and CuAl2 phases by well distributed AlN nanoparticles in the filler matrix.
3.5 Aluminum and copper brazing with AlN-reinforced filler
Figure 8 shows the aluminum and copper brazing using a conventional Al4047 and 0.10% AlN-reinforced filler to compare the microstructure and IMC growth at the brazed joint. In a conventional Al4047, it is observed that both the CuAl2 and Cu9Al4 IMC layers were formed on the Cu substrate with a mean thickness of 170.79 and 5.14 μm, respectively. In addition, both Si particles with a mean length of 4.93 μm and CuAl2 IMC were found on the Al substrate, as shown in Fig. 8(a).
Al/Cu dissimilar brazing using (a) conventional A14047 and (b) 0.10% AlN-reinforced filler matrix.
On the other hand, the mean thickness of both CuAl2 and Cu9Al4 IMCs using a 0.10% AlN-reinforced filler on the Cu substrate were 126.17 and 4.71 μm, respectively, as shown in Fig. 8(b). In addition, the mean length of Si was approximately 4.18 μm, which is decreased by 2.64% as compared to the conventional Al4047. This result suggests that AlN nanoparticles in the filler matrix play an important role in the decrease in the IMC thickness as well as the Si particles due to the adsorption theory [29,30]. In other words, nanosized AlN particles can adsorb on the surface of IMCs and Si particles that result in a decrease in the IMC growth between the filler and substrates because it acts as an obstacle for the interdiffusion of Cu and Al atoms.
Figure 9 shows the EDS analysis of the interfacial region using the elemental mapping to determine the composition distribution and inter-diffusion area of the AlN-reinforced filler. It is observed that the interface can be divided into four regions and Cu is mainly distributed in regions A (Cu9Al4) and B (CuAl2), while it is detected with a small amount Cu in regions C and D which mean Al-rich constituents.
EDS mapping of the interfacial region after Al/Cu dissimilar brazing with 0.10% AlN reinforced filler matrix.
Consequently, it can be concluded that Cu is diffused from the Cu substrate and reacted with the Al filler metal to from a strong bond. The other elements like Si and Sn are uniformly distributed at the brazing region.
We also inferred that the both Al and Cu substrates are favorably melted and wetted by capillary effect of the filler, which results in a sound metallurgic bonding. In the conventional brazing, an alloy is formed by inter-diffusing from the interface between the base metal and the filler. Normally, higher brazing temperature can result in higher wettability of the filler, owing to the increase in the diffusion coefficient. The relation between the brazing temperature and diffusion coefficient can be expressed by the Arrhenius equation [31].
where d is the diffusion length, D is the diffusion coefficient, and t is the brazing time. The diffusion coefficient (D) increases with an increasing heating temperature as follows.
where D0 is the constant, Ea is the activation energy, R is the gas constant, and T is the Kelvin temperature. If the inter-diffusion between the base metal and molten filler metal is high, a dissolution phenomenon can occur and it is easy to be observed at the Al brazing process because there is not much difference in the melting point between the Al filler metal and the Al base metal [32].
4. CONCLUSION
The effect of nanosized AlN powders in the Al filler metal matrix has been studied. The important conclusions are given as follows.
(1) The thicknesses of Si and IMC keep decreasing with further addition of nano sized AlN powders up to 0.10% in the filler.
(2) The liquidus point of the 0% nanosized AlN powders in the filler was approximately 528.3°C. However, it decreased to 527.7, 525.9, and 524.5°C with additions of 0.01, 0.05, and 0.10% AlN in the filler, respectively.
(3) The spreading ratio drastically increases by addition of AlN nanoparticles up to the 0.10% AlN powders in the filler due to a uniform distribution of nano sized AlN powders in the filler resulting from the decrease in surface tension and increase in the fluidity of the filler.
(4) The tensile strength is 51.03 MPa in the 0% AlN nanoparticles and it gradually increases to 53.70 and 59.23 MPa in the 0.05 and 0.10% AlN nanoparticles, respectively.
(5) At the dissimilar brazed joint between Al and Cu, the growth of both IMC thickness and Si particles was suppressed by addition of nanosized AlN powders in the conventional Al filler metal matrix.