The Effect of the Surface Energy of Water Glass on the Fluidity of Sand
Article information
Abstract
In recent years, the metal casting industry has sought to meet ever more stringent environmental standards. Inorganic binders based on silicate chemistry have many advantages with respect to environmental issues, but often suffer from reduced strength, burn-on and poor water-resistance. In particular, when sand is mixed with a water glass based inorganic binder, it adversely affects fluidity. In this study, a Powder flow test (PFT) analysis was conducted to confirm the effect of the surface tension of water glass on mixed sand. Certain additives were selected as surfactants to lower the surface tension of the water glass. The characteristics of the samples were measured using the PFT. A correlation between the surface tension of the water glass and the fluidity of the mixed sand was established. We then evaluated the effect of the inorganic binder on core strength. Using the surfactants, the fluidity of the mixed sand increased by 66%. However, strength and water resistance were reduced by approximately 45%. As a result, it was found that when 1.5% of surfactant was added, the resulting fluidity and humidity strength characteristics produced a mixed sand with good properties. Water glass with improved fluidity can produce a high quality core and mold. Finally, we used a practical application prove that an inorganic binder can replace organic binders in foundry cores.
1. INTRODUCTION
The foundry industry and its supplies are faced with increasingly complex environmental regulations as well as increasing concerns in the area of worker safety. In recent years, the metal casting industry has sought to meet these ever more stringent environmental standards. The use of traditional aluminum casting based organic binders poses several problems, including the emission of volatile organic compound (VOC)s, smoke and odors. Conventional organic binders are responsible for up to 70% of a foundry’s VOC emissions [1-3].
Inorganic binders solve these environmental issues. A fabricated inorganic binder has many advantages for precision casting, such as low heat treatment (about 1,000 °C), the absence of a gelling agent, high strength, enhancement of collapse, easy processability, and high thermal stability. Also, inorganic binders based on silicate chemistry have many environmental advantages. Sodium silicate solutions, commonly known as water glass, have been used in large scale industrial applications and have been studied in academic research for more than 100 years [4-5].
Water glass can be used in the synthesis of advanced materials, such as ordered mesoporous silica. The nature of the silica source dramatically affects the properties of the final material prepared. Water glass, is composed of different proportions of sodium oxide and silica. It has been used for many years a non-toxic and low priced water-soluble silicate, as an effective inhibitor and passivator, to prolong the corrosion resistance of metals. But these inorganic binders often suffer from low strength, burn-on and poor water-resistance. Above all, mixing sand with a liquid inorganic binder adversely affects its fluidity. The fluidity or dryness of the mixed-sand is the most important factor in manufacturing the core and mold. High fluidity mixed-sand increases the filling of the core and mold, increasing strength and preventing the problem of burn-on. If the drying speed of the sand is too fast, it is not possible to produce the core and molds.
In this paper, the surface tension of water glass was decreased to improve the fluidity of mixed sand. Surfactants were used to reduce its surface tension. PFT (Powder flow test) analysis was conducted to confirm the effect of the surface tension of the water glass on mixed sand. Surfactants were selected as additives to lower the surface tension of the water glass. The effect of reduced water glass surface tension on the fluidity of the mixed sand was confirmed by the PFT. In addition, the influence of the fluidity of the mixed sand on the strength of the core and the strength of the water resistance was confirmed. Finally, we confirmed these characteristics using an actual core for a car engine.
2. EXPERIMENT
2.1 Materials
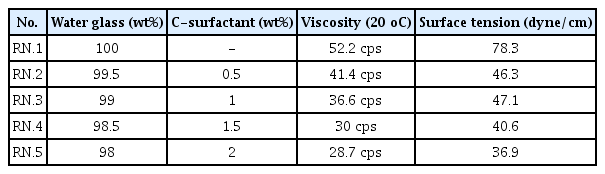
We prepared our sample composition using water glass (ACENANOCHEM. Co. Lrd) and C-surfactant (sodium hexyldiphenyl ether sulfonate, DOW. Co. Lrd.). The properties of the water glass are shown in Table 1. The initial water glass SiO2:Na2O molar ratio was 2.5 and viscosity was 52.2 cps. The properties of the C-surfactant are shown in Table 2. It was selected considering its capacity for dissolving in water glass. The surfactant reacted with the water glass at 75 °C for 1hr. Basic formulations and experimental ranges to the additive surfactant are shown in Table 3.
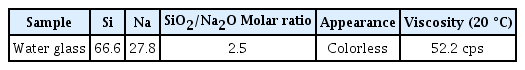
Physical properties of prepared water glass
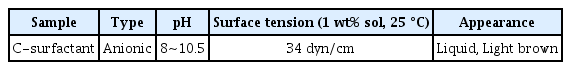
Properties of C-surfactant
Sample composition prepared for testing
2.2 Characteristics
The inorganic binder was characterized by thermogravimetric analysis (TGA, Q500, TA Instruments, USE) and viscosity by viscometer (DV2T Viscometer, Brookfield, USA). Water glass thermal gravimetric analyses were used to determine the mass retained following exposure to high temperatures (up to 1,000 °C). Water glass undergoes a dramatic reduction in mass between 100 °C and 200 °C. The weight loss is believed to be due to the evaporation of water. In the 200-400 °C region, it was observed that the mass was smoothly reduced due to evaporation of the determinate water. There were no changes in mass observed at 400°C or higher. Table 3 shows the change in viscosity with the addition of the surfactant. As the amount of surfactant was increased, the viscosity decreased by 55%.
The surface tension of the SiO2 film was measured using a tension meter (Dynometer, BYK gardner GmbH, Germany) at 25 °C, and the contact angle (Phoenix 150, SEO, Korea) of the prepared water glass was also measured. Surface tension reading were measured at interval over several hours until constant values were obtained. Each water glass was mixed with sand to produce mixed sand. The sand used was AFS55 vietnam sand. The acidity of vietnam sand is pH 6.8, the salt content is 11 ppm, and the SiO2 content is 97.4%. A water glass of 3 wt% with respect to sand was mixed with a casting mixer (YOUNGJIN MACHINERY CO., LTD) at 300 rpm for 150 s to prepare the mixed sand. The fluidity of the mixed sand was analyzed using PFT (BROOKFIELD, USA). The flow function graph shows the collapse of fluidity after applying 5 times consolidation stresses and 3 times shear stresses at a pressure of 5 kPa.
For mechanical analyses, the samples were shot into an inorganic binder core machine (KITECH, Korea). The sample size was 175 × 22.4 × 22.4 mm. Samples were then cured at 150 °C for 70s. The fracture strength of each water glass was measured using a universal testing machine (HEUNGJIN, Korea). Each sample was measured at 1, 10, and 50 minutes at room temperature. The strength of the sample was determined after an exposure of 1, 2, and 3 hours, in an atmospheric state with an absolute humidity of 29.9 g/cm3. Finally, we confirmed the characteristics of an actual car engine core.
3. RESULTS AND DISCUSSION
3.1 Surface tension and contact angle of the prepared water glass
Table 3 shows the surface tension results of the prepared water glass; RN.1 had the highest value at 78.31, and RN.2 and RN.3 had similar surface tension because of the addition of the surfactant. On the other hand, the surface tension was significantly reduced in RN4. and RN.5. The addition of less than 1 wt% surfactant resulted in a surface tension reduction of about 40%. It can be seen that adding more than 1 wt% reduced the surface tension by more than 50%.
This paper used water glass as a binder to combine sand. Therefore, to check the degree that the water glass was involved in the wetting of the sand, the contact angle was checked by dropping the water glass on the SiO2 surface. The contact angle of RN.1 was 28.9°. The contact angle increased up to sample RN.4 and then decreased again with RN.5. The results indicated RN.1 had the best wetting with sand and RN.4 the worst.
The binder was determined to form micelles as the C-surfactant content increased. However, in RN.5, a reverse micelle was formed due to a repulsive force with the SiO2 substrate.
The contact angle indicates when the liquid is in thermodynamic equilibrium with the solid surface, and is used to evaluate the wettability of a liquid on a solid surface. Low contact angles result in high wettability, indicating the solid surface is hydrophilic and has a high surface energy value. In particular, when the contact angle is 0 °C, the amphipathic on the solid surface is maximum and results in perfect wetting of the solid surface. On the other hand, a high contact angle means low wettability and low surface energy due to hydrophobicity [23-25].
Side views of the contact angle of prepared water glass droplet on SiO2 substrate : (a) RN.1, (b) RN.2, (c) RN.3, (d) RN.4 and (e) RN.5
3.2 Powder Flow Test (PFT) of the mixed sand
The fluidity of the mixed sand is one of the main factors influencing the production of the core and the mold. Mixed sand with good fluidity has a positive effect, increasing the strength by increasing the filling density of the core and the mold. But when the mixed sand is lacking fluidity, the result leads to poor production characteristics, such as non-filling.
The primary measure of powder fluidity is the powder flow function - which is a measure of the amount of strength the material retains at a stress free surface following consolidation to a given stress level. The simplest way of explaining the flow function is with the uniaxial unconfined failure test shown in Fig 2, which measures the strength of a free standing column of powder. (a) Consolidation of sample: Powder is placed in a cylindrical cell and compacted under normal stress, σ1. (b) Unconfined sample: The mold is now carefully removed to reveal a compacted column of powder. (c) Unconfined failure of sample: The normal stress acting on the column of powder is gradually increased until failure occurs, and the peak normal stress, σc, is recorded. The uniaxial unconfined failure test is conducted over a range of consolidation stresses and the flow function is constructed by plotting the unconfined failure strength versus the consolidation stress as shown in Fig 2 [16-18]. Unlike liquids and semisolids, powders display fluidity that is dependent upon the applied consolidating pressure. By determining yield stress (known as the unconfined failure strength) across a range of consolidation stresses it is possible to generate a flow function such as those shown in the flow function curves [15].
Sand castle (unconfined failure) test : (a) Consolidation stage, (b) Failure stage and (c) Broken Sample.
Fig 3 is a flow function graph showing the fluidity results of the mixed sand, that is, the extent that the sand particles collapse with respect to the stress applied to the accumulated sand. The flow function graph has a certain degree of curvature, which shows the rate of increase in failure strength as the consolidating stress increases. The lower the flow function slope, the better the fluidity. In dry sand, almost no slope values are measured, and the flow function slope is 0.02 because fluidity is good, due to the dry state of the sand. However, when water glass (RN.1~RN.5) is used, the slope value increases. When some moisture (water glass) is added to the sand, the binder liquid and sand particles are attracted each other by capillary attraction. This results in a reduction in fluidity.

Flow function curves of prepared samples.
When the C-surfactant was added, the fluidity increased in RN.2 to RN.5, as compared to RN.1 The fluidity of RN.5 was especially excellent. It is believed that the surfactant reduces cohesion between the sand particles [20]. It was confirmed that when 2% surfactant was added the fluidity of the mixed sand was improved by about 66%.
The friction angle according to flow function is shown in Fig 4. The friction angle is friction caused by particles flowing against each other under increasing consolidation stresses, expressed as an angle of the internal friction of the powder against itself. Friction angle measurements are translated into powder cohesive strength. Free flowing powders generally have an angle of < 30° [20]. From the friction angle results shown in Fig 4 and Table 4, the sand was observed to be so fluid that the friction angle values could not be not measured. On the other hand, the friction angle for RN.1 was 67.8°. This is because sand mixed with water glass has significant friction between the particles. The fraction angle value decreased from RN.2 to BN.5, as compared to RN.1. As a result, the surfactant was found to reduce friction between particles, thereby improving the fluidity of the mixed sand. It was also found that the friction between the particles increased when the amount of added surfactant was greater than 1.5%, as seen in the case of RN.4 and RN.5.
Friction angle curves of prepared samples.
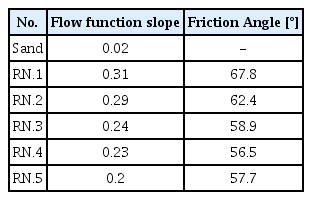
Providing key data from flow function slope and friction angle result
As the contact angle of the SiO2 surface and water glass increases, the sand and water glass becomes less wet in a hydrophobic state. Using the friction angle results, it can be determined that the larger the contact angle of the SiO2 surface and water glass, the more positive the mixed sand fluidity. For RN.1, the contact angle was the lowest and the friction angle was the highest. On the other hand, RN.4, which had the largest contact angle, had the lowest frictional angle value. Thus, we can see that the fluidity was best when RN.4, was used. It was also found that the lower the surface tension of the water glass, the better the fluidity.
3.3 Strength test of prepared core
Surfactants are sensitive to humidity because they have hydrophilic groups in their structure. Cores made of water glass should have adequate strength at room temperature and structural integrity should be maintained when exposed to molten metals.
Also, the cores should maintain their strength in a humid atmosphere. The fabricated core was left to stand at room temperature for 1, 10, and 50 minutes, and its strength was measured. After this, strength was measured after standing for 1, 2 and 3 hours in an absolute humidity of 29.9 g/cm3. Fig 5 shows the strength value at room temperature, and Fig 6 shows the strength value at absolute humidity.
Strength test results of prepared sample.
Humidity strength test of prepared samples.
As shown in Fig 5, the initial strength of RN.1 was 174 N/cm3 at 1 minute, which is immediately after the mold removal, and the maximum strength was 294 N/cm3, which was after leaving it for 50 minutes. It is apparent that the strength values increase with time. On the other hand, as shown in Fig 6, it was confirmed that at an absolute humidity of 29.9 g/cm3 the strength of the core gradually decreased over time, and the 3 hour moisture absorption strength was about 160 N/cm3, which was lower than the initial strength immediately after mold removal. Since water glass (xSiO2-yNa2O) is hygroscopic, it absorbs moisture from the air and this lowers the binding force of the inorganic binder [19].
The results in Fig 6 show that for RN.2 to RN.4, it the initial strength and the final strength were similar to RN.1. However, RN.5 showed a decrease in strength of about 20-30%. This means that when 2 wt% or more of the surfactant is used, it may affect the binding force of the water glass. In addition, the intensity of RN.2 to RN.5 decreased with time. The intensity of RN.5 was 33 N/cm3 after 3 hours of moisture absorption, which was 80% lower than that of RN.1. The hydrophilicity of the surfactant seems to have influenced the strength of the core. The results showed that no more than 2 wt% of surfactant can be used because additional surfactant reduces the water glass strength.
3.4 Engine core production assessment
RN.4 which exhibited good strength and fluidity was selected to produce the core of an automotive engine. In Fig 7, a look at the flow of the mixed sand within the hopper shows good sand movement for RN.4. For RN.1 the tunneling phenomena is observed due to low fluidity. Mixed sand with good fluidity makes a core with good filling ability.

Movement of mixed sand within the hopper : (a) RN1 and (b) RN4.
Fig 8 shows that, some good filling has occurred for RN.4. From these results, it can be seen that the fluidity of the mixed sand affects the production of a high quality core.
Filling of the core produced from mixed sand : (a) RN1 and (b) RN4.
4. CONCLUSIONS
In this paper, a correlation between the surface tension of the water glass and the fluidity of the mixed sand was established. Subsequently, the effect of this correlation on the production of the core and mold was also confirmed.
A surfactant was used to reduce the surface tension of the water glass, and as the amount of added surfactant was increased, it was confirmed that the surface tension of the water glass decreased and the fluidity of the mixed sand improved. Also, comparing the friction angle and contact angle on the SiO2 surface, it was determined that when 1.5 wt% of the surfactant was added, the contact angle was the largest and the friction angle was smallest. When the amount of added surfactant was less than 1.5%, the strength of the water glass was similar, and the friction angle decreased. When the amount of added surfactant was 2%, the fluidity of the mixed sand was improved by up to 66%. However, it was confirmed that humidity decreased strength by about 45%.
As a result, it was found that when 1.5% of surfactant was added, the resulting characteristics of fluidity and humidity strength can produce a mixed sand with good properties. Water glass with improved fluidity can produce a high quality core and mold.
Acknowledgements
This work was supported by the Technology Innovation Program (20000126) and (10067386) funded by the Ministry of Trade, Industry & Energy (MOTIE, Korea) and the support of the Korea Institute of Industrial Technology as (KITECH EO200014).