A Further Study on Knoop Indentation Plastic Deformation for Evaluating Residual Stress
Article information
Abstract
A method for evaluating residual stress using an instrumented indentation test was developed some decades ago. More recently, another method was developed, using a Knoop indenter. The conversion factor ratio, which is one of the key factors in the evaluation algorithm, has been taken to be 0.34, although this value comes from an experimental result and its physical meaning has not been examined. Here we examine the physical meaning of this conversion factor from the previous residual stress model, and calculate its ratio using analytical model of the stress field beneath the indenter. In this process, we assumed that the conversion factor ratio was the ratio of the projected area of the plastic zone generated during the Knoop indentation test. An analysis of the stress field beneath the indenter was performed by FE simulation. Actual nanoindentation was conducted after Knoop indentation testing, using the interface-bonding technique, to identify the plastic zone. In addition, the conversion factor ratio was also calculated for the case where residual stress was present, and the geometric ratio of the Knoop indenter was different. A comparison of our results with those from previous studies showed that the conversion factor ratio obtained using our assumption was in good agreement with previous studies.
1. Introduction
Residual stress is generated in materials during heat treatment machining, and this stress has emerged as an important factor in assessing a product. Numerous studies have investigated ways of measuring residual stress, including with XRD [1], hole-drilling [2], and other methods. Instrumented indentation testing (IIT) is an increasingly popular method because it is non-destructive and the test procedure is simple. In addition, it can be used in the field and can be used to assess various other mechanical properties as well [3-5,25-26].
Methods of evaluating residual stress using IIT have expanded over the past decade [6-9]. Lee and Kwon [6,7] recently suggested a technique for evaluating non-equibiaxial stress states using a Vickers indenter. After that, Choi et al. [10] proposed a way to evaluate residual stress using a Knoop indenter that permits evaluation even when the ratio of principal stress directions of the residual stress is unknown. In that study, each load difference was expressed by introducing a conversion factor (α) in two directions (the horizontal and vertical directions) as shown in Fig 1. They expressed the relationship between the principal stresses and the load difference as
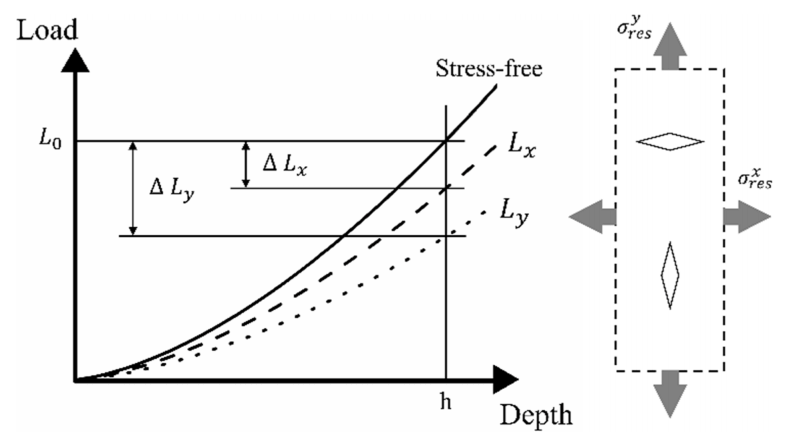
Schematic indentation loading curves for Knoop indentation
where
The present study investigates the physical meaning of the conversion factor ratio, α⊥ to α//. To identify it, we studied it theoretically, by analyzing the stress field beneath the indenter and also performed indentation tests. Then, from FE analyses of various situations where residual stress was present, we defined the physical meaning of the conversion factor ratio by comparison with previous experimental results.
2. Materials and Methods
2.1 Finite element analysis
Finite element analysis was used to study the size of the plastic zone beneath the indenter. Using Abaqus 6.14, a Knoop indenter was designed with a 7.11:1 ratio of major to minor axis and ∠172· and ∠130· respectively. The indenter body was a 3D discrete rigid type and consisted of 2114, 118 elements of the R3D4 type. The specimen had a cuboid shape, a 3D deformable type, and a C3D8 8-node brick element type of 67,156 elements. For more precise results, the mesh was set to fine at the indent center and was increased moving away from the center. The specimen was fixed for the simulation by applying boundary conditions at the bottom. The mechanical properties of the specimen were based on STS304L material, with an elastic modulus of 200 GPa, Poissons’s ratio 0.3, yield strength 360MPa and tensile strength 750MPa. The Knoop indentation simulation allowed the indenter body to penetrate 100 μm into the specimen surface and return to the original position considering nonlinear geometry.
2.2 Indentation testing
Knoop indentation and nanoindentation were performed to compare the results of the FE analyses with the plastic zone generated during indentation. The materials were 3 mm × 3 mm × 1 mm S20C and STS304L cuboids. To observe the plastic zone beneath the Knoop indenter, an interface-bonding technique [13,14] was used. This technique is well known as a way to observe the deformation beneath the indent in the indentation testing of metallic materials. Even though the plastic behavior during indentation in an interfaced specimen does not completely match that in bulk indentation, several studies [13-20] have reported that similar deformation mechanics can be observed. Specimen preparation is as follows. First, the specimen is cut exactly in half. Next, the cut surfaces are polished precisely and bonded with a high-strength adhesive. Then, Knoop indentation is performed along the long and short axes of the cut line. After that, the bonded specimen is immersed in acetone to dissolve the bond. Finally, nanoindentation is carried out on the crosssection of the de-bonded surface.
Knoop indentation was carried out on the top of the bonded specimen. AIS3000 (Frontics. Inc., Seoul, Korea) was used for indentation testing with 588 N (60 kgf) loading and unloading. For the nanoindentation, the cross-section of the specimen was polished once again with 0.3 μm alumina particles. Nanoindentations were made in the area beneath the Knoop indent using an Ultra Nanoindentation system (Anton Paar, Switzerland). In the experiments, a Berkovich indenter was used and the maximum loading was 50 mN.
3. Results and Discussion
In previous studies [9,10], the conversion factor (α) in the Knoop indentation test was defined as:
Since the conversion factor is a relationship between stress and load, it can be inferred that it has units of area. Since the Knoop indenter has two-fold symmetry and axes of different lengths (unlike the usual Vickers indenter), it can respond more sensitively to the residual stress direction. This implies that the conversion factor is related to the projected area where the residual stress arises.
For simplicity, imagine that the projected areas corresponding to the short-axis direction and long-axis direction of the Knoop indenter are taken as the conversion factors. Since the areas in the short-axis direction and the long-axis direction have the same height, their ratio is the length of the short-axis and the long-axis and the conversion factor ratio can be expressed as the ratio of these lengths. The difference between the value of this ratio (about 0.14 [1:7.11] from the indenter geometry) and that found in previous research [9,10] indicates that the projected area of the Knoop indenter geometry is not directly related to the conversion factor. However, considering the previous residual stress model [6,7], the indentation load difference (∆L) is related to the deviatoric stress and the deviatoric stress affects plastic deformation. From this, it can be inferred that the conversion factor, which introduces a relationship between the load difference (∆L) and the residual stress is related to the concept of plastic deformation rather than the Knoop indenter itself. Therefore, it is reasonable to look for the meaning of the conversion factor in plastic deformation during indentation.
The stress field beneath the indenter has been of interest to many researchers. The plastic zone can be analyzed simply using the hemisphere-shaped plastic zone, and the cavity model [21]. In this way, we can approach the plastic zone mathematically. In the expanded cavity model of Gao et al. [22], an equation for the plastic zone radius beneath the indenter in conical indentation is proposed:
where a is the contact radius, c is the radius of the plastic zone, E is the elastic modulus, σythe yield strength and α the semi-included angle of the conical indenter. From equation (5), the projected area R of each plastic zone arising in a conical indentation having an angle corresponding to the long and short axes of the Knoop indenter can be calculated, and yields a ratio value of 0.27 (
Figure 2 shows the plastic zone beneath the indenter as observed in the Knoop indentation simulation. The plastic zone is identified in the FE analysis as being in the PEEQ 0.1 ~ 0.5 range; that zone is marked in Fig 2 and the other areas are marked in blue. The ratio of the projected areas of the plastic zone in the long-axis and short-axis directions in the simulation is 0.321. This result differs by about 5% from the ratio used in previous studies [9,10], which is in reasonably good agreement since the previous value was obtained experimentally. However, the experimental value of Han [9] was obtained by inverting the results in the presence of residual stresses, and therefore we need further simulation to determine the residual stressed state. Before the Knoop indentation simulation, 100 and 200 MPa of residual stress was applied in the x and y directions, respectively, and the ratio was calculated from the projected area of the plastic zone. The ratios of the projected plastic-zone area in each residual stress state, as shown in Table 1, have an error range of about 10% from the 0.34 obtained by Han [9]. This suggests that the real experiment and the simulation are not completely identical. In particular, Choi [10] and Kim [24] stressed the manufacturing limitations of indenters used for measuring residual stress. It is difficult to manufacture indenters with ideal ratios, unlike the indenters designed in simulations. In addition, the mechanical properties used in our FE simulation may differ from those from which the experimental relations in previous studies were derived. Bearing these factors in mind, we believe that the results obtained here show reasonable agreement with those of previous studies, and we believe that our result should be considered in agreement with Choi’s study: that the conversion factor ratio is independent of the residual stress [10].

Simulation of the plastic zone beneath a Knoop indentation

Ratio of the projected area of the plastic zone in FE simulation results and experimental result
Figure 3b)-c) shows the results of nanoindentation on the interface-bonded surface used to verify the plastic zone beneath the Knoop indent. As shown in Fig 3, nanoindentation was conducted in a region where the plastic zone was expected to occur and the hardness was measured on each cross-sectional region of the long and short axes. The average hardnesses of S20C and STS304L were 2.95 GPa (±0.34 GPa) and 5.95 GPa (±0.30 GPa), respectively. These values were obtained by performing nanoindentation on a region unaffected by Knoop indentation. The load-displacement curves of both the plastic zone and the unaffected region are shown as Fig 4a)-b). The hardness values from nanoindentation fluctuated slightly. The point with a value that was greater than that obtained from the side part is indicated in red in Fig 3b)-c) to distinguish it from points of equal or lower values than the average. Based on this, a virtual plastic semi-ellipsoid region (referring to the simulation results) was drawn. The depth of the ellipsoid plastic zone was the same in the cross-sectional area of the plastic zone, since the indentation depth was the same on both the long-axis and short-axis. In addition, since the area equation of the semi-ellipsoid is expressed as a function of the length of the indentation direction and the surface direction, if the depth is the same, then the ratio of the crosssectional areas is determined by the ratio of the length of the surface direction. The projected area ratios of the plastic zone in S20C and STS304L obtained from the above process were 0.32 and 0.35, respectively. These values are relatively consistent with the conversion factor ratio, 0.34, from, previous studies [9,10], and it is thus reasonable to assume that the conversion factor ratio is the ratio of the projected area of the plastic zone beneath the indenter.

a) Nanoindentation results on interface-bonded sample (b) S20C, c) STS304L)

Load-depth (displacement) curves of a) S20C and b) STS304L
The Knoop indenter used in this study had a ratio of long-axis to minor axis of 7.11:1. However, depending on difficulties in the experimental environment, such as a very narrow area or an elbow of a pipeline, the length in the x- and y-directions of the Knoop indenter may change, and that means the conversion factor ratio must also be prepared for each change. Choi et al. [10], in reporting this issue, expressed a fitting equation by observing the change of the conversion factor ratio according to the indenter geometry diagonal ratio through FE analysis. Kim et al. [24], also identified this change in their modified Berkovich work. Therefore, for our assumption to be valid, it is necessary to find the ratio of the plastic zone occurring during indentation relative to the diagonal change in the Knoop indenter.
Modified Knoop indenters with long to short-axis ratios of 3.5:1 and 14:1 were designed using FE simulation. Table 1 shows the ratio of the projected area of the plastic zone obtained using the analysis procedure described above. For diagonal ratios of 3.5:1 and 14:1, the ratios were 0.189 and 0.518, respectively; the conversion factor ratio increased when the long-axis was shorter compared to the long-axis of 7.11:1, and vice versa. These results are very similar to those in Choi and Kim [10,24] as shown in Fig 5, and support the conclusion that the conversion factor ratio depends on the indenter geometric shape and not on the magnitude of residual stress, as mentioned in their studies.

Relation between conversion factor ratio and diagonal ratio of Knoop indenter
4. Conclusion
We discussed the physical meaning of the conversion factor ratio used as an experimental result when estimating residual stress using indentation. Based on the estimation algorithm, we expected the conversion factor ratio to be related to plastic deformation. FEA studies and hardness mapping were conducted for verification, assuming that the conversion factor ratio was the ratio of the projected area of the plastic zone beneath the indenter. Our results were compared with experimental results from previous studies, and were confirmed to agree well, even when residual stress was present and the indenter diagonal was changed. Finally, based on the results of our analyses, we defined the conversion factor ratio to be the ratio of the projected area of the plastic zone under the indenter.
Acknowledgements
This work was supported by the National Research Foundation of Korea (NRF) grant funded by the Korea government (MSIT) (No. 2020R1A5A6017701), and the Basic Science Research Program through the National Research Foundation of Korea (NRF) funded by the Ministry of Education (No. NRF-2018R1D1A3B07048712).