Evaluation of the Mechanical Properties of ZnO Nanorods Treated with Oxygen Plasma using Atomic Force Microscopy
Article information
Abstract
Zinc oxide (ZnO) simultaneously exhibits semiconducting and piezoelectric properties. ZnO in the form of nanorods has been studied intensively for application in self-powering devices. The power generation in piezoelectric nanogenerators based on ZnO nanorods can be improved via several approaches, including an oxygen plasma treatment. When ZnO nanorods are exposed to oxygen plasma, the charge carrier concentration decreases and the piezoelectric output voltage consequently increases. However, the effects of oxygen plasma on the mechanical properties of ZnO nanorods has not been systematically studied using a precise measurement technique. Given the size of ZnO nanorods, atomic force microscopy (AFM) is a suitable method for manipulating individual ZnO nanorods and measuring their elastic properties. In the present work, we observed the effects of oxygen plasma on the elemental composition and microstructure of ZnO nanorods. First of all, the surface roughness of the ZnO nanorods was analyzed using AFM, revealing that it increased due to the etching effect of the oxygen plasma. From X-ray photoelectron spectroscopy (XPS) measurements, three distinct peaks corresponding to lattice oxygen, oxygen vacancies, and absorbed oxygen on the surface were identified. The XPS analysis results showed that oxygen vacancy defects on the ZnO nanorods were decreased by oxygen plasma treatment. Next, the effects of oxygen plasma on the elastic properties of ZnO nanorods were studied using lateral force microscopy. It was confirmed that the elastic modulus of ZnO nanorods increased due to the reduced number of defects originating from oxygen vacancies.
1. Introduction
Zinc oxide (ZnO) is a II-VI compound semiconductor with a wurtzite structure that exhibits both semiconducting and piezoelectric properties [1,2]. A dense array of ZnO nanorods can be facilely grown using several synthesis methods [3,4]. In particular, ZnO nanorods can be grown in low-temperature conditions via hydrothermal synthesis, which makes this growth method suitable for use on flexible plastic substrates [5]. When stress is externally applied to vertically aligned ZnO nanorods, piezoelectric potential is generated via the deflection of the nanorods [6,7]. Diverse structures of piezoelectric nanogenerators have been developed based on this electromechanical coupling effect in ZnO nanorods [8].
The performance of a piezoelectric nanogenerator based on ZnO nanorods can be enhanced via several approaches. For instance, the output electrical energy from vertically grown ZnO nanorods can be improved by optimizing the aspect ratio of the ZnO nanorods [9,10]. The crystal quality and piezoelectric power generation are dependent on the growth method used [11]. Furthermore, a piezoelectric nanogenerator based on ZnO nanorods is sensitively influenced by oxygen and humidity levels [12]. For instance, oxygen plasma treatment can reduce the charge carrier concentration, enhancing the generation of piezoelectric potential [13].
With oxygen plasma treatment, the oxygen vacancies on the surface of ZnO nanorods become filled by oxygen molecules combining with free electrons to form oxygen ions [12]. During this process, the elastic property of the ZnO nanorods can be altered. The effects of oxygen plasma on the mechanical properties of ZnO nanorods has been investigated using a nanoindentation method, and the results showed that the stiffness of ZnO nanorods can be enhanced by such treatment [14]. However, given the size of ZnO nanorods, a more precise and suitable measurement method is required to evaluate changes in the elastic properties of ZnO nanorods.
Atomic force microscopy (AFM) has been preferentially used to characterize the mechanical and piezoelectric properties of ZnO nanorods [7,15]. A typical AFM tip has a radius of less than 100 nm and is hence suitable for measuring and manipulating individual ZnO nanorods. Conductive AFM [7] and piezoresponse force microscopy (PFM) [16] have been effectively used to study the piezoelectric properties of ZnO nanorods via direct and inverse piezoelectric effects, respectively. In addition, when operating AFM in contact mode on vertically aligned ZnO nanorods, the enhanced stiffness of the ZnO nanorods can be precisely measured by lateral force microscopy (LFM) [15]. LFM is commonly used to measure friction force on the microscale by monitoring the degree of torsion in the AFM cantilever [17]. This working principle can be effectively exploited to monitor changes in the elastic properties of free-standing ZnO nanorods after an oxygen plasma treatment.
In the present study, we investigated the effects of oxygen plasma on a dense array of ZnO nanorods using LFM. First of all, the change in the surface roughness of the ZnO nanorods by oxygen plasma etching was analyzed using AFM topography images. Then, changes in the elemental composition and microstructure of the ZnO nanorods caused by oxygen plasma were analyzed by X-ray photoelectron spectroscopy (XPS) and X-ray diffraction (XRD), respectively. Finally, the effects of oxygen plasma on the elastic properties of ZnO nanorods were studied using LFM.
2. Experimental Methods
ZnO nanorods were hydrothermally grown on a p-type silicon wafer substrate by seed layer formation and a subsequent nanowire growth process [18]. First, the silicon wafer was ultrasonically cleaned using acetone, ethyl alcohol, and deionized water for 10 min each, in sequence. To form the seed layer, a cleaned silicon wafer was immersed in a solution of 50 mM zinc acetate dihydrate [Zn(CH3COO)2·2H2O] (Samchun, Korea) and ethyl alcohol at 80 ºC for 30 s, and then subsequently annealed at 100 ºC for 5 min in air. The seed layer formation process was repeated three times. The ZnO nanorods were then synthesized at a 1:1 molar ratio of zinc nitrate hexahydrate [Zn(NO3)2·6H2O] (Samchun, Korea) and hexamethylenetetramine [(CH2)6N4] (HMTA, Kanto, Japan) in a 50 mM precursor solution with deionized water at 80 ºC for 24 h. Finally, the ZnO nanorods grown on the silicon wafer were cleaned with deionized water to remove any residual particles on the surface.
The ZnO nanorods were treated with oxygen plasma using a RF magnetron sputtering system. The oxygen plasma treatment was intended to reduce oxygen vacancies, as reactive oxygen plasma diffuses through ZnO nanorod surfaces and traps electrons, as depicted in Fig 1 [19,20]. The surface wettability of the ZnO nanorods was photographed using a contact angle meter (CAM-200, KSV). The surface morphology of the ZnO nanorods was observed using a field emission scanning electron microscope (FE-SEM, JSM-6700F, Jeol). XRD patterns of the ZnO nanorods on the silicon wafer were obtained using an X-ray diffractometer (DE/D8 Advance, Bruker) with Cu-Kα radiation. The XPS spectra of the ZnO nanorods were measured using a high-performance X-ray spectroscopy (HP-XPS, K-Alpha+, Thermo Fisher Scientific). The XPS spectra were analyzed by peak fitting software (Avantage Data System, Thermo Fisher Scientific). LFM and surface roughness measurements were conducted using an AFM (XE-150, Park Systems). The topography signals originate from error signals in the feedback circuit, and LFM signals are generated from the torsional behavior of the cantilever detected via a position-sensitive photodetector (PSPD) (see Fig 2). To measure lateral force and surface roughness, two distinct AFM probes were chosen, based on their spring constants. To fully deflect nanorods, an AFM probe with a large spring constant is required. On the other hand, it is necessary to avoid deflecting nanorods to accurately measure the surface roughness of nanorods. Accordingly, the AFM probes PPP-NCHPt (42.0 N/m) and ElectriCont-G (0.2 N/m) were used to measure lateral force and surface roughness, respectively. LFM measurements were taken at a normal force level of 420 nN and a frequency of 0.2 Hz. To measure the surface roughness of the ZnO nanorods, AFM scans were conducted at a normal force level of 10 nN and frequency of 0.2 Hz to minimize deflections of the vertically aligned ZnO nanorods.

Schematic of the oxygen plasma treatment of a ZnO nanorod. Oxygen vacancies of a ZnO nanorod are filled with reactive oxygen, combining with free electrons to form oxygen ions.
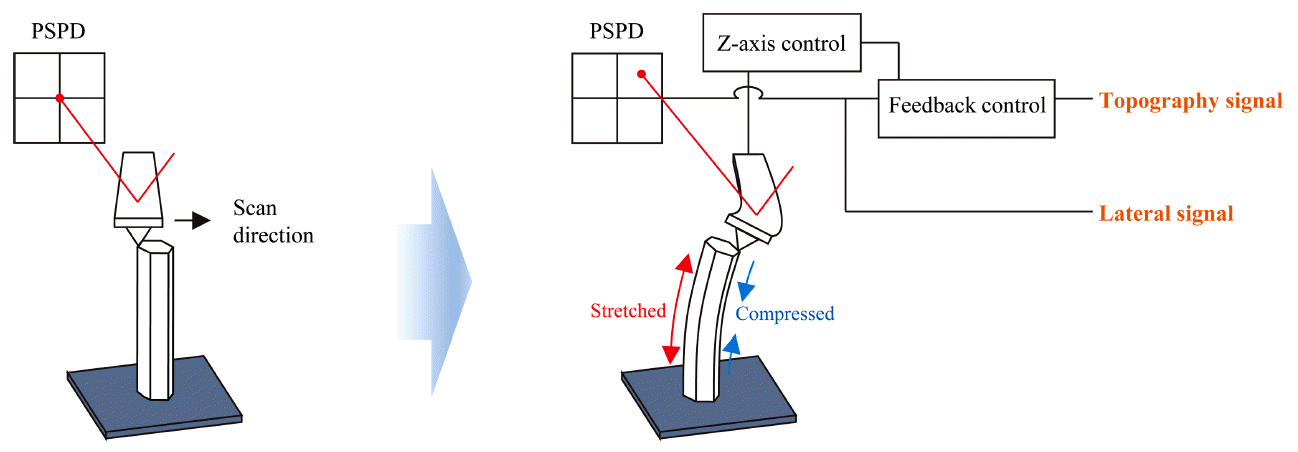
Schematic of the imaging of a ZnO nanorod using lateral force microscopy. When the AFM probe scans a free-standing ZnO nanorod, it deflects the nanorod due to the finite response time in the feedback circuit. The torsional behavior of the cantilever is monitored by the PSPD, producing LFM signals.
It should be noted that even though LFM measurements were carried out on a densely grown ZnO nanorod array, the spring constant of the AFM probe (NCHPt) and the set point were large enough to sufficiently deflect the nanorods. When the AFM probe scans the ZnO nanorods, there can be interference between the nanorod deflected by the AFM tip and the neighboring nanorods, to some extent. Thus, the LFM signals measured from an array of nanorods can be considerably influenced by the density of the nanorod array.
3. Results and Discussion
Fig 3 (a) and (b) shows the contact angles of the as-grown and oxygen-plasma-treated ZnO nanorods, respectively, as measured by a sessile-drop goniometry technique. The contact angle (θc) is defined as the angle between the top surface of the substrate and a line tangent to the water-air interface [21]. Approximately 1.5 μl of water droplets were dispensed onto the ZnO nanorod sample surfaces, and after 2 ‒ 3 seconds for stabilization, images were then captured. A water droplet dispensed on an as-grown ZnO nanorod sample shows hydrophilicity (θc=27 °) resulting from the presence of Zn cations, O anions, and OH groups on the surface [22]. However, the spread of a water droplet on an oxygen-plasma-treated ZnO nanorod sample exhibited a significantly low contact angle. This enhanced hydrophilicity implies that the surface roughness and oxidation were enhanced by the oxygen plasma treatment [23,24], as investigated further by AFM (Fig 4) and XPS (Fig 6).
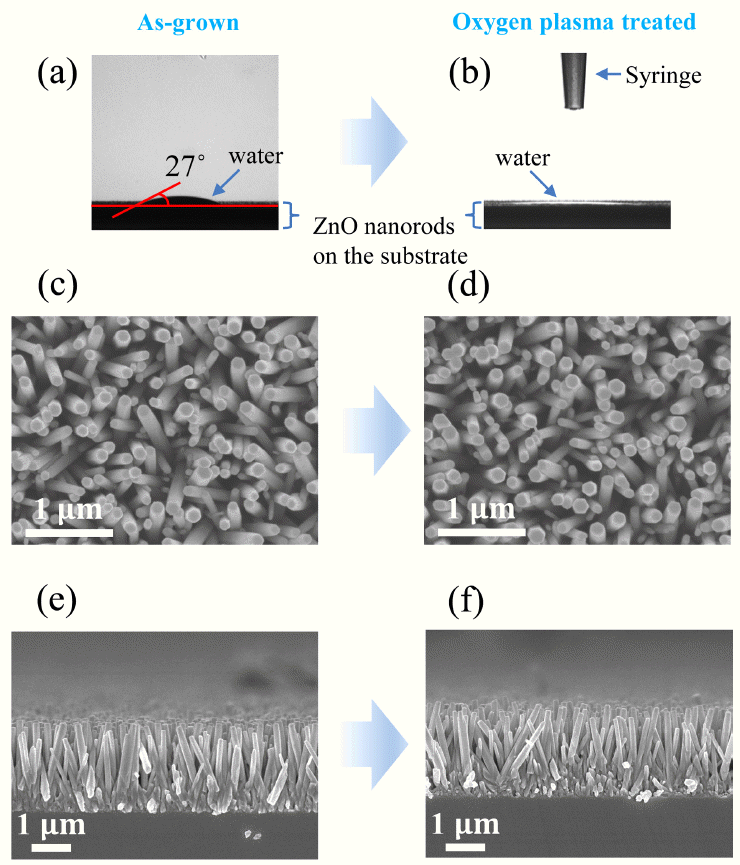
The surface wettability of ZnO nanorods was evaluated by a contact angle meter (a) before and (b) after the oxygen plasma treatment. Top view of ZnO nanorods (c) before and (d) after the oxygen plasma treatment, and side view of ZnO nanorods (c) before and (d) after the oxygen plasma treatment.

Surface roughness measurements of ZnO nanorods. AFM topography images (a) before and (b) after the oxygen plasma treatment. The small areas marked by rectangles in (a) and (b) were reproduced using Matlab in three-dimensional images in (c) and (d). The numbers “1” ‒ “4” in (c) and (d) indicate their corresponding rectangular areas in (a) and (b), respectively.
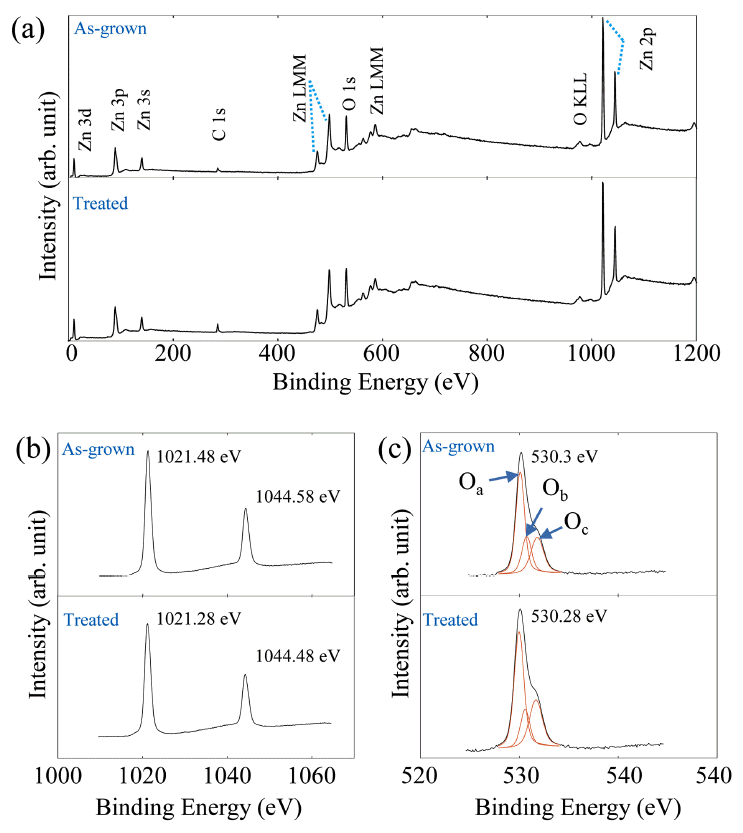
XPS measurements of the ZnO nanorods: (a) XPS spectra of ZnO nanorods before and after the oxygen plasma treatment. (b) Zn 2p regions and (c) O 1s peaks before and after the oxygen plasma treatment are highlighted.
Meanwhile, Fig 3(c) and (e) show a top and a side view of the as-grown ZnO nanorods, respectively. Fig 3(d) and (f) correspondingly depict a top and a side view of the oxygen-plasma-treated ZnO nanorods, respectively. Both the asgrown and oxygen-plasma-treated ZnO samples clearly exhibit the formation of nanorods. As indicated in Fig 3(e) and (f), both the as-grown and oxygen-plasma-treated ZnO nanorods are well aligned perpendicular to the substrate. There was no remarkable change in the morphological characteristics after the oxygen plasma treatment, that is, the diameter, length, and alignment were not affected by the oxygen plasma.
Since the effect of oxygen plasma treatment on the surfaces of ZnO nanorods could not be clearly observed in the SEM images, we measured the surface roughness of the ZnO nanorods using AFM. This is because the etching effect of oxygen plasma may be observed in a subtle morphological change in the surface of the ZnO nanorods. As mentioned earlier, AFM was operated in contact mode in a scan condition with a normal force of 10 nN and a frequency of 0.2 Hz to obtain optimal topography images of free-standing ZnO nanorods. Fig 4(a) and (b) shows the topographic images of the ZnO nanorods before and after the oxygen plasma treatment, respectively.
To evaluate the change in surface roughness caused by the oxygen plasma treatment, four areas were selected from the top surfaces of the ZnO nanorods, as marked in Fig 4(a) and (b). Subsequently, the topographical data of the as-grown and oxygen-plasma-treated ZnO nanorods were reproduced as three-dimensional images (see Fig 4(c) and (d)). These images indicate that the surface roughness of the ZnO nanorods was increased by the oxygen plasma treatment. For a quantitative analysis of the surface roughness, the rootmean-square (RMS) roughness was computed for these local regions. Table 1 shows that the RMS roughness values of the oxygen-plasma-treated sample were larger overall than those of the as-grown sample.

RMS surface roughness values for the four local areas in Figs. 4(a) and (b) (unit: μm).
An important effect of oxygen plasma is surface etching by ion bombardment [25]. In an earlier work [26], oxygen plasma was applied to ZnO films and the surface roughness increased because the surface particles were etched. The increased RMS roughness of the ZnO nanorods here can also be explained by this etching effect.
Fig 5 shows the XRD patterns of as-grown and oxygen-plasma-treated ZnO nanorods. The intensity scales were adjusted based on the (002) peak for a comparative analysis, showing a strong preferential c-axis orientation, as indicated by the (002) peak. In the XRD patterns, both the as-grown and oxygen-plasma-treated ZnO nanorods exhibit a hexagonal crystal system, a wurtzite structure, which can be confirmed by the (100), (002), (101) peaks at 2 theta = 31.8 º, 34.4 º, and 36.2 º, respectively [27]. Except for the SiO2 peak in Fig 5(b) originating from the silicon substrate, there were no remarkable peak shifts in the XRD patterns between the asgrown and oxygen-plasma-treated ZnO nanorods. Thus, it could be verified that no phase transition of the ZnO nanorods was induced by the oxygen plasma treatment.

XRD measurements of the ZnO nanorods. XRD profiles of the ZnO nanorods (a) before and (b) after the oxygen plasma treatment.
The full width at half maximum (FWHM) of the as-grown and oxygen-plasma-treated ZnO nanorods in the (002) reflection were 0.06 º and 0.054 º, respectively. This decrease in FWHM indicates an improvement in the crystallinity, which was attributed to new Zn-O bonds with fewer oxygen vacancies.
Fig 6 presents the XPS spectra of the as-grown and oxygen-plasma-treated ZnO nanorods to clarify their chemical composition and elemental state. Fig 6(a) shows the XPS analysis results of the zinc, oxygen, and reference carbon elements. The Zn 2p regions and O 1s peaks are highlighted in Figs 6(b) and (c), respectively. From Fig 6(b), the Zn 2p3/2 and Zn 2p1/2 peaks located at ~1021.38 eV and ~1044.53 eV, respectively, can be observed. The binding energy differences (~23 eV) between the Zn 2p3/2 and the Zn 2p1/2 peaks in the as-grown and oxygen-plasma-treated ZnO nanorods indicate the Zn2+ oxidation state [28,29].
Fig 6(c) displays the XPS spectra of the O 1s core levels with oxygen-dependent defects. The three fitted peaks at ~530.1 eV, ~530.5 eV and ~531.9eV correspond to lattice oxygen (Oa), an oxygen vacancy (Ob), and absorbed oxygen on the surface (Oc), respectively [30,31]. To analyze the effects of oxygen plasma on the XPS peak originating from oxygen vacancies, the area ratio of Ob to Oa was compared using a published method [32].
Here, the Ab values of the as-grown and oxygen-plasma-treated ZnO nanorods were 0.29 and 0.24, respectively. This decrease indicates that oxygen vacancy defects were decreased by the oxygen plasma treatment [14,32].
To observe the effects of the oxygen plasma on the elastic properties of the ZnO nanorods, LFM measurements were taken of the as-grown and oxygen-plasma-treated ZnO nanorods. Fig 7(a) and (b) show histograms of the LFMsignals obtained during trace and retrace scans for the as-grown and oxygen-plasma-treated ZnO nanorods, respectively. To represent counts of >5 V effectively, all of the histograms are shown in a 0 – 500 count range. With regard to the LFM measurements, in each case 512 × 128 data points were obtained from a 10 µm × 5 µm area.
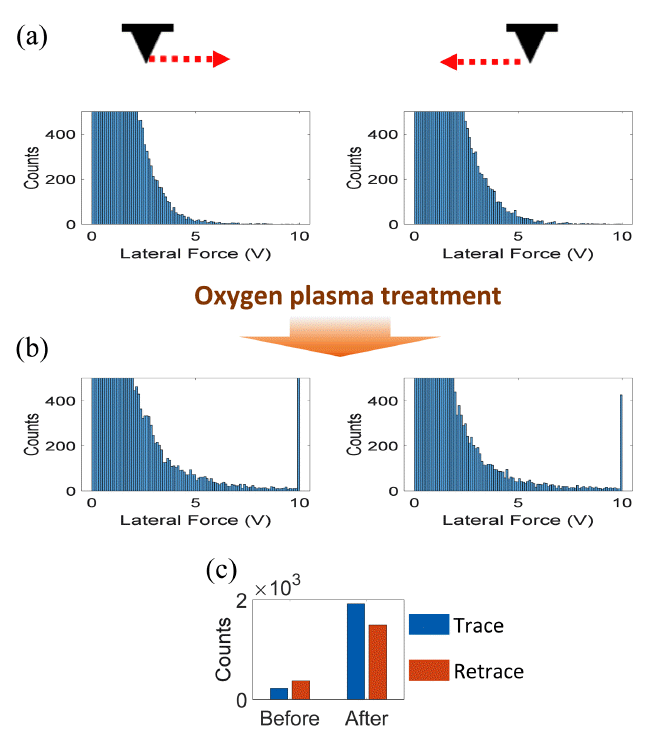
Statistical analysis of the LFM measurements on the ZnO nanorods: (a) counts vs. LFM signals during trace and retrace scans, (b) counts vs. LFM signals during trace and retrace scans after the oxygen plasma treatment, and (c) total counts of the LFM signals of >5 V during trace and retrace scans before and after the oxygen plasma treatment.
It should be noted that LFM signals are positive and negative during trace and retrace scans, respectively. Thus, absolute values were used in Fig 7. Fig 7(a) and (b) indicate that the counts corresponding to the LFM signals of > 5 V increased after the oxygen plasma treatment. The total counts for the signals of > 5 V are presented in Fig 7(c), which shows remarkable increases after the oxygen plasma treatment.
In addition, the counts corresponding to the maximum LFM signal (10 V) increased from 1 (trace) and 1 (retrace) to 664 (trace) and 410 (retrace) due to the oxygen plasma treatment. It should be noted that in the present study raw LFM signals were used to evaluate the enhanced elastic property of the ZnO nanorods, but these voltage signals can be converted into the unit of force through several force calibration methods [33]. Additionally, in the AFM instrument used in the present study measurable LFM signals are in the range of 0 ‒ 10 V. Thus, all the LFM signals larger than 10 V were also represented as 10 V.
Increased LFM signals from the ZnO nanorods due to the oxygen plasma treatment can be observed in the results of the statistical analysis shown in Fig 7, and can also be confirmed from the three-dimensional LFM images in Fig 8. Fig 8(a) presents LFM images obtained from the as-grown ZnO nanorods during trace and retrace scans, and Fig 8(b) shows them after the oxygen plasma treatment. First, it is evident that, overall, the LFM signals increased after the oxygen plasma treatment. In the as-grown sample, LFM signals near 10 V were detected from only a few ZnO nanorods. However, after the oxygen plasma treatment, LFM signals at 10 V could be observed from several ZnO nanorods. It should be noted that the LFM measurement results shown in Fig 7 and Fig 8 are different depending on the scan direction. This is attributed to the deflection of the ZnO nanorods during the growth process. As can be seen from Fig 3, individual ZnO nanorods tend to randomly deflect during the hydrothermal synthesis. Thus, during LFM measurements, the deflection of ZnO nanorods by the AFM tip would differ depending on the scan direction, resulting in the different LFM images from the trace and retrace scans.
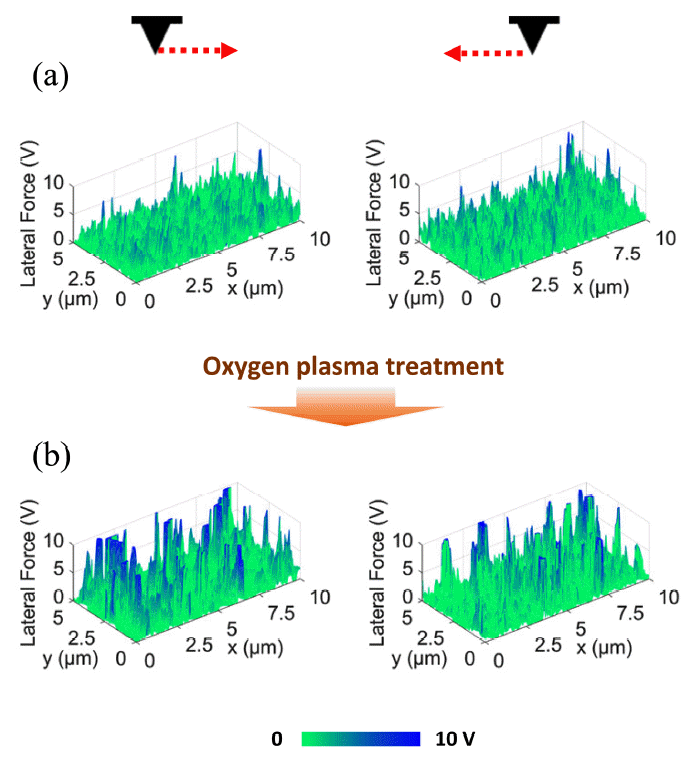
Three-dimensional LFM images: (a) LFM images were obtained during trace and retrace scans before the oxygen plasma treatment and (b) after the oxygen plasma treatment.
An LFM signal originates from the torsional behavior of the AFM cantilever. The increase in LFM signals from the ZnO nanorods caused by the oxygen plasma treatment can be explained by the relationship between the elastic modulus and the applied lateral force. This is expressed by the following equation [15],
where f is the lateral force applied to a ZnO nanorod, E is the elastic modulus, I is the moment of inertia, x is the lateral displacement, and L is the length of a ZnO nanorod. Given that the effect of oxygen plasma on the morphology of the ZnO nanorods is almost negligible, the increase in f is caused by the enhanced E. This enhancement of elastic property by oxygen plasma can be explained by the reduction in the number of defects associated with oxygen vacancies [14].
It should be noted that oxygen plasma treatment was carried out using a substrate bias method in the magnetron sputtering system, as stated in the Experimental methods section. Given the thickness of the ZnO nanorod layer (2‒3 µm) and the dense array of nanorods, it is speculated that the upper parts of the nanorods were more influenced by oxygen plasma treatment than the nanorods’ sidewalls. However, in the present study, the chemical and structural analyses using XPS and XRD to investigate the local effect of oxygen plasma treatment on ZnO nanorods were constrained, due to insufficient measurement resolution. The etching efficiency of the oxygen plasma can differ on the top surface and the sidewall of a nanorod. With the ZnO nanorod samples grown by the hydrothermal synthesis method used in the present study, obtaining an accurate surface roughness for the sidewall of a ZnO nanorod is difficult, given the densely grown nanorod array. Measuring the local surface roughness of nanorods would be possible only for a much less densely grown nanorod sample. Meanwhile, Li et al. [34] has reported that the upper parts of ZnO nanorods were preferentially etched by Ar plasma treatment. However, no such differential etching rate of oxygen plasma treatment on ZnO nanorods was reported in the previous work by Hussain et al. [14], and it was not clearly observed in the SEM images (Figs 3(c)‒(f)) of the present study.
In summary, the critical effect of oxygen plasma treatment on the mechanical properties of ZnO nanorods is the filling of oxygen vacancies with reactive oxygen. This was confirmed by the O 1s peak analysis in the XPS spectra; the Ab in Eq. (1) decreased from 0.29 to 0.24, indicating new ZnO bonding. The reduced oxygen vacancies were also confirmed via structural analysis using XRD. Improved crystallinity was observed in the ZnO nanorods based on the decrease in FWHM in the (002) peak (from 0.06 ° to 0.054 °). This enhancement in crystallinity by oxygen plasma is responsible for the enhanced elastic property of the ZnO nanorods, which was clearly confirmed by the significant increase in the number of LFM signals > 5 V. The quantitative analyses results of the chemical, structural, and mechanical properties are summarized in Table 2.

The effect of oxygen plasma on the chemical, structural, and mechanical properties of ZnO nanorods.
4. Conclusion
An oxygen plasma treatment was conducted on a dense array of ZnO nanorods grown via a two-step hydrothermal synthesis process, using a RF magnetron sputtering system. No noticeable change in the morphology of the ZnO nanorods was observed after the oxygen plasma treatment. However, an increase in the surface roughness of the ZnO nanorods was caused by the etching effect of oxygen plasma, as confirmed by the increase in the RMS roughness measured via AFM topography images. Meanwhile, from XRD measurements, no significant peak shift was detected after the oxygen plasma treatment, except for a peak originating from the oxidized silicon substrate. The results of contact angle measurements showed that the hydrophilicity of the ZnO nanorods was increased by oxygen plasma, implying that the surface oxidation and roughness were enhanced. An XPS analysis of the chemical composition found that oxygen vacancies in the ZnO nanorods were decreased by oxygen plasma. LFM measurements were taken on vertically aligned ZnO nanorods, and the degree of torsion in the AFM cantilever was monitored during trace and retrace scans. Overall, the LFM signals increased and the number of signals near the maximum LFM signal level (10 V) increased significantly after the oxygen plasma treatment. The increase in the elastic modulus of the ZnO nanorods by oxygen plasma was induced by the reduced number of defects associated with oxygen vacancies.
Acknowledgements
This study was supported by the Research Program funded by the SeoulTech(Seoul National University of Science and Technology).